
EUR/USD
🔹 Overall Sentiment:
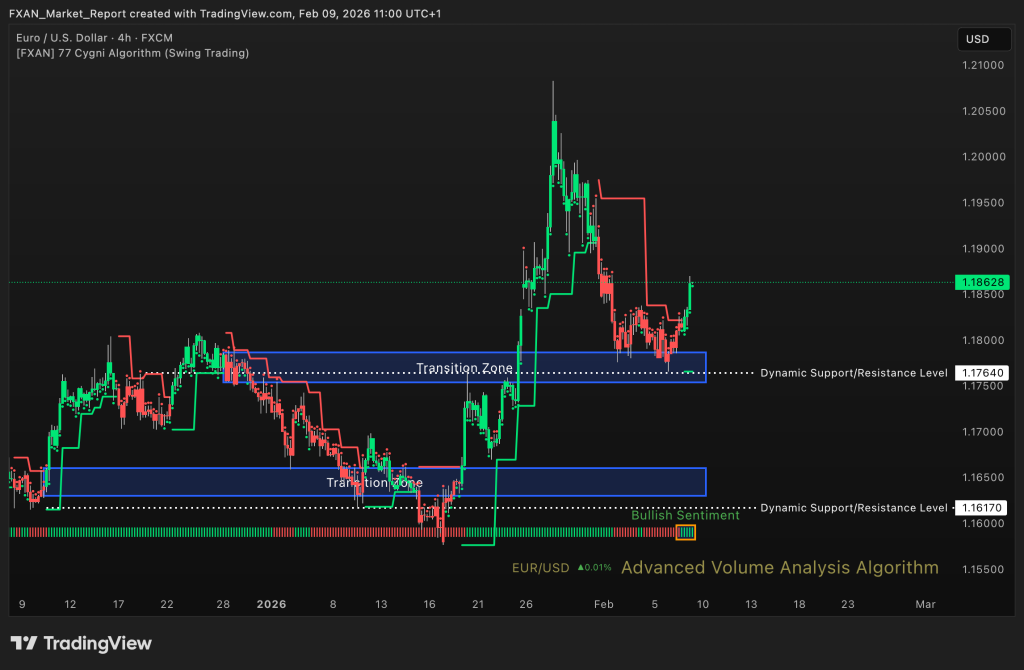
Bullish – EUR/USD maintains a bullish sentiment over the last few days, supported by strong upward momentum and higher lows. Price continues to trade above key structural levels, indicating buyers remain in control. Bullish flow is still dominant despite minor consolidations. As long as price holds above critical support, the bullish bias remains intact.
🔹 Transition Zones:
1.16300 to 1.16600 – Bullish Transition Zone.
This zone represents a strong accumulation area from previous price action. It continues to act as a major demand region where buyers previously stepped in aggressively.
1.17540 to 1.17865 – Bearish Transition Zone.
This zone has recently acted as a pivot area and was successfully reclaimed. Holding above it strengthens the bullish continuation outlook.
🔹 Dynamic Support/Resistance Levels:
Price: 1.17640
This level is acting as near term support after the breakout. Sustained price action above it confirms bullish market structure.
Price: 1.16170
This is a deeper structural support and aligns with prior bullish reversals. A move below this level would weaken the current bullish bias.
🔹 Commentary:
Momentum remains constructive with buyers defending pullbacks effectively. Volume behavior supports continuation rather than distribution. Any retracement toward higher support levels may attract renewed buying interest. Overall structure favors further upside while price remains above key supports.
GBP/USD
🔹 Overall Sentiment:
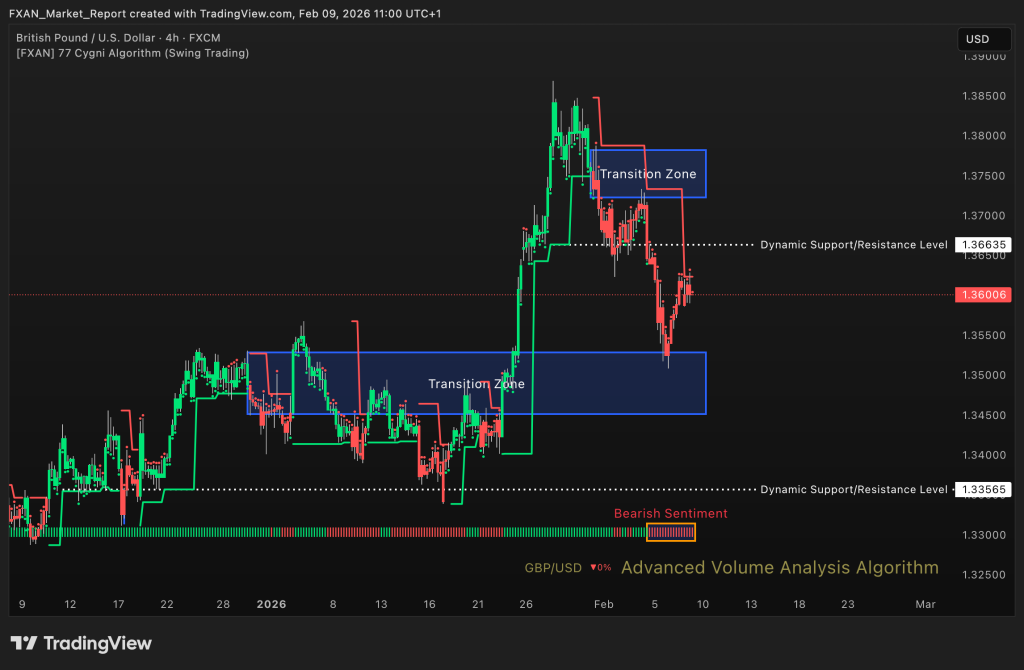
Bearish – GBP/USD has sustained a bearish sentiment for more than a week, driven by strong impulsive moves and higher highs. Buyers continue to dominate despite short term pullbacks. Market structure remains firmly bullish above major support levels. Momentum suggests continuation rather than exhaustion.
🔹 Transition Zones:
1.34515 – 1.35285– Bearish Transition Zone.
This lower transition zone marks a strong base where accumulation previously occurred. It remains a critical support region for maintaining the bullish structure.
1.37230 – 1.37820– Bearish Transition Zone.
This upper transition zone represents a key resistance area where price previously reacted. A clean break and hold above it would open the door for further upside expansion.
🔹 Dynamic Support/Resistance Levels:
Price: 1.33565
This level acts as long term structural support. Holding above it keeps the broader bullish trend intact.
Price: 1.36635
This level is a near term pivot and currently functions as support. Sustained trading above it reinforces bullish continuation.
🔹 Commentary:
The pair continues to show healthy bullish structure with controlled pullbacks. Selling pressure remains corrective rather than impulsive. Buyers are clearly defending higher price levels. As long as price holds above key supports, upside bias remains favored.
GOLD (XAU/USD)
🔹 Overall Sentiment:
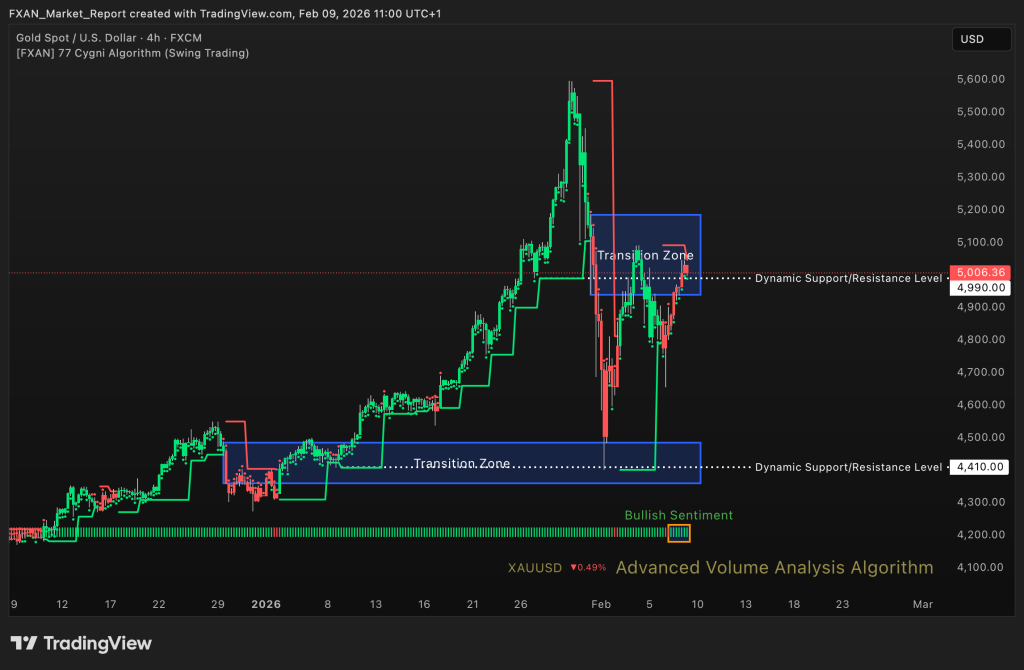
Bullish – Gold maintains a bullish sentiment over the last few days, supported by strong directional moves and elevated volatility. Price action continues to respect higher value areas despite sharp intraday swings. Buyers remain active on pullbacks, keeping bullish structure intact. Overall trend strength remains elevated.
🔹 Transition Zones:
4360 – 4485 – Bearish Transition Zone.
This zone represents a major long term accumulation area. It continues to act as a strong demand base and structural support.
4940 – 5185 – Bearish Transition Zone.
This zone is currently the active value area where price is consolidating. It defines the battleground between short term profit taking and trend continuation.
🔹 Dynamic Support/Resistance Levels:
Price: 4410
This level is a critical structural support aligned with the lower transition zone. A break below would significantly weaken bullish structure.
Price: 4990
This level is acting as an important near term pivot. Holding above it supports further upside attempts.
🔹 Commentary:
Gold remains highly reactive but structurally bullish. Sharp pullbacks are being absorbed quickly by buyers. Volatility suggests active participation rather than distribution. As long as price holds above major support, bullish continuation remains the dominant scenario.
WTI (Crude Oil)
🔹 Overall Sentiment:
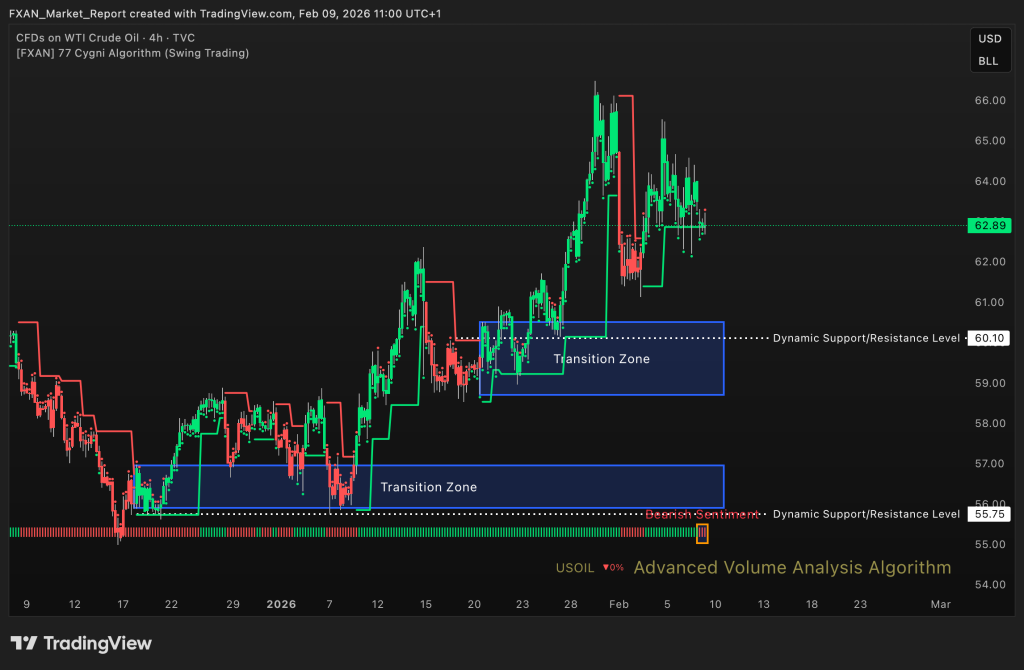
Bearish – WTI Crude Oil has shifted into a bearish sentiment over the last three days following a clear rejection from higher levels. Selling pressure has increased and bullish momentum has weakened. Price is currently struggling to reclaim broken support. The short term bias favors further downside unless structure improves..
🔹 Transition Zones:
55.90 – 56.95 – Bullish Transition Zone.
This zone represents a strong historical demand area. It remains a key downside target if bearish pressure continues.
58.70 – 60.50 – Bullish Transition Zone.
This zone acted as a consolidation range before the recent move lower. It is now a resistance area that sellers are defending.
🔹 Dynamic Support/Resistance Levels:
Price: 55.75
This level is a major downside support and aligns with previous reversal points. A break below it would accelerate bearish continuation.
Price: 60.10
This level has flipped into resistance after the breakdown. Price acceptance above it would be needed to neutralize bearish bias.
🔹 Commentary:
Market structure has weakened with lower highs forming. Selling pressure remains dominant in the short term. Any rebounds are currently corrective in nature. Bears remain in control while price trades below key resistance.
S&P 500
🔹 Overall Sentiment:
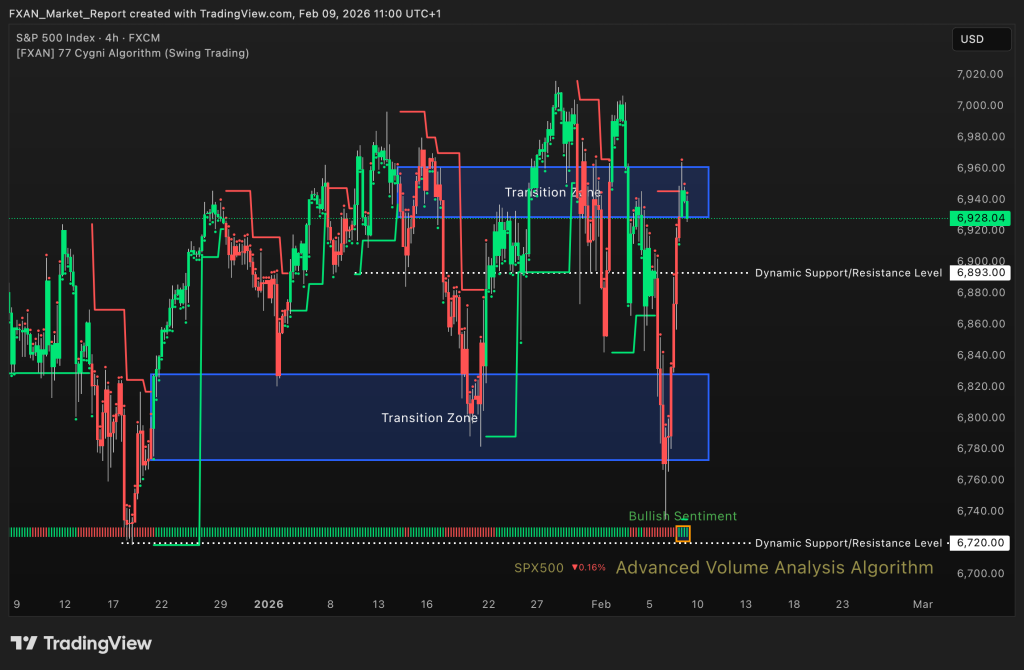
Bullish – The S&P 500 maintains a bullish sentiment for more than a week, supported by strong recovery moves and higher structure. Buyers continue to defend pullbacks aggressively. Market participation remains constructive despite periods of volatility. Overall structure favors continuation to the upside.
🔹 Transition Zones:
6773 – 6828 – Bullish Transition Zone.
This zone acts as a major support base following previous consolidation. It is a key area where buyers previously regained control.
6929 – 6961 – Bearish Transition Zone.
This upper transition zone represents a resistance area near recent highs. Sustained acceptance above it would signal further bullish expansion.
🔹 Dynamic Support/Resistance Levels:
Price: 6720
This is a critical structural support level. Holding above it preserves the broader bullish trend.
Price: 6893
This level acts as near term support within the current structure. Price stability above it strengthens bullish confidence.
🔹 Commentary:
Equity momentum remains positive with buyers actively supporting the market. Pullbacks continue to be shallow and controlled. Volatility has not disrupted the overall structure. Trend bias remains bullish while price holds above key support.
BTC/USD (Bitcoin)
🔹 Overall Sentiment:
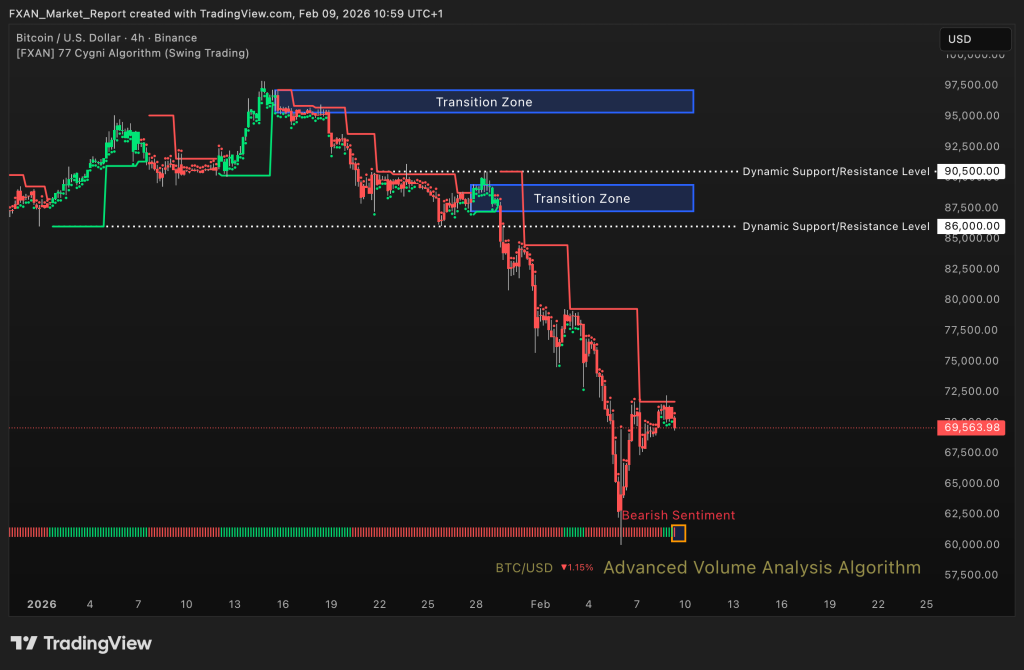
Bearish – BTC/USD shows bearish sentiment over the last two hours following renewed selling pressure. Price has failed to reclaim broken structure and remains under heavy resistance. Downside momentum is dominant in the short term. Sellers continue to control intraday price action.
🔹 Transition Zones:
95,300 – 97,150 – Bearish Transition Zone.
This upper transition zone represents a major distribution area. Any rally into this region would likely face strong selling pressure.
87,250 – 89,400– Bullish Transition Zone.
This zone acted as the last consolidation before the breakdown. It is now a key resistance region.
🔹 Dynamic Support/Resistance Levels:
Price: 88,200
This level has flipped into resistance after the breakdown. Price remaining below it confirms bearish structure.
Price: 90,500
This is a higher timeframe resistance and marks the boundary for trend invalidation. A reclaim above it would be required to shift bias.
🔹 Commentary:
Bitcoin remains vulnerable to further downside in the short term. Selling pressure is strong and rebounds lack follow through. Market structure remains bearish below key resistance zones. Until price reclaims critical levels, downside risk remains elevated.