
EUR/USD
🔹 Overall Sentiment:
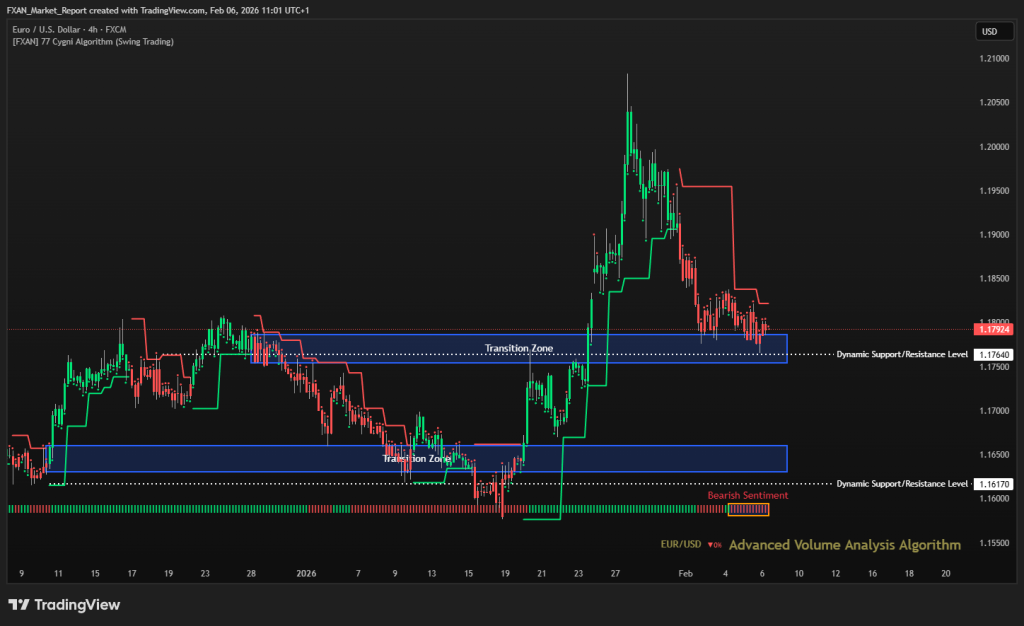
Bearish – EUR/USD is showing bearish sentiment for the last two days, with price failing to sustain momentum after the previous impulsive rally. The market is consolidating just above a key dynamic level, suggesting distribution rather than accumulation. Selling pressure remains controlled but persistent, keeping the short term bias tilted to the downside. As long as price remains capped below recent highs, bearish sentiment dominates.
🔹 Transition Zones:
1.16300 to 1.16600 – Bullish Transition Zone.
This lower transition zone represents a strong demand area where buyers previously stepped in aggressively. A revisit of this zone could trigger a technical reaction, but acceptance below it would significantly weaken the broader structure.
1.17540 to 1.17865 – Bearish Transition Zone.
Price is currently interacting with this upper transition zone, which is acting as a supply area. Failure to reclaim and hold above this zone reinforces the short term bearish bias and limits upside continuation.
🔹 Dynamic Support/Resistance Levels:
Price: 1.17640
This level is acting as a near term pivot and has already shown rejection. Sustained trading below it keeps pressure on the downside and confirms sellers remain in control.
Price: 1.16170
This lower dynamic level represents a critical support area for the broader structure. A clean break below it would open the door for deeper downside continuation.
🔹 Commentary:
Current price action reflects consolidation after a strong upside impulse, with momentum clearly slowing. Volume behavior suggests distribution rather than renewed buying interest at current levels. Short term pullbacks toward the lower transition zone remain technically valid. A shift back to bullish sentiment would require a strong reclaim of the upper transition zone with follow through.
GBP/USD
🔹 Overall Sentiment:
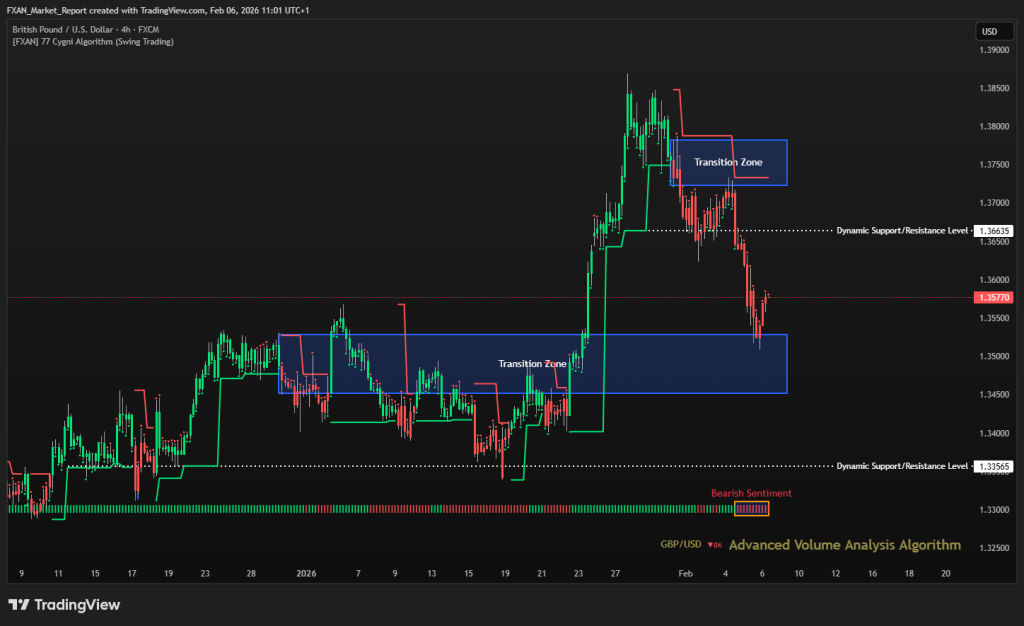
Bearish – GBP/USD has shifted into a bearish sentiment over the last two days, following a strong rejection from recent highs. The market has transitioned from impulsive upside movement into a corrective phase, with sellers gaining short term control. Price is now trading below a key dynamic level, confirming weakening bullish structure. Unless buyers step back in decisively, downside pressure is likely to persis.
🔹 Transition Zones:
1.34515 – 1.35285– Bearish Transition Zone.
This lower transition zone represents a key demand area where price previously consolidated before the impulsive move higher. A move into this zone could attract short term buyers, though acceptance below it would signal further structural weakness.
1.37230 – 1.37820– Bearish Transition Zone.
The upper transition zone acted as a strong supply area and capped the recent rally. Rejection from this zone confirms seller dominance and reinforces the current bearish bias.
🔹 Dynamic Support/Resistance Levels:
Price: 1.33565
This level serves as an important downside reference and potential support. A clean break below it would likely accelerate bearish continuation.
Price: 1.36635
This level is now acting as resistance after the recent breakdown. Failure to reclaim it keeps the market firmly tilted to the downside.
🔹 Commentary:
Price action suggests distribution following the prior bullish impulse, with momentum clearly rolling over. Volume behavior supports the idea of sellers defending higher levels aggressively. Short term pullbacks toward resistance are being sold, maintaining bearish pressure. A return to bullish sentiment would require a strong reclaim of the upper transition zone with sustained follow through.
GOLD (XAU/USD)
🔹 Overall Sentiment:
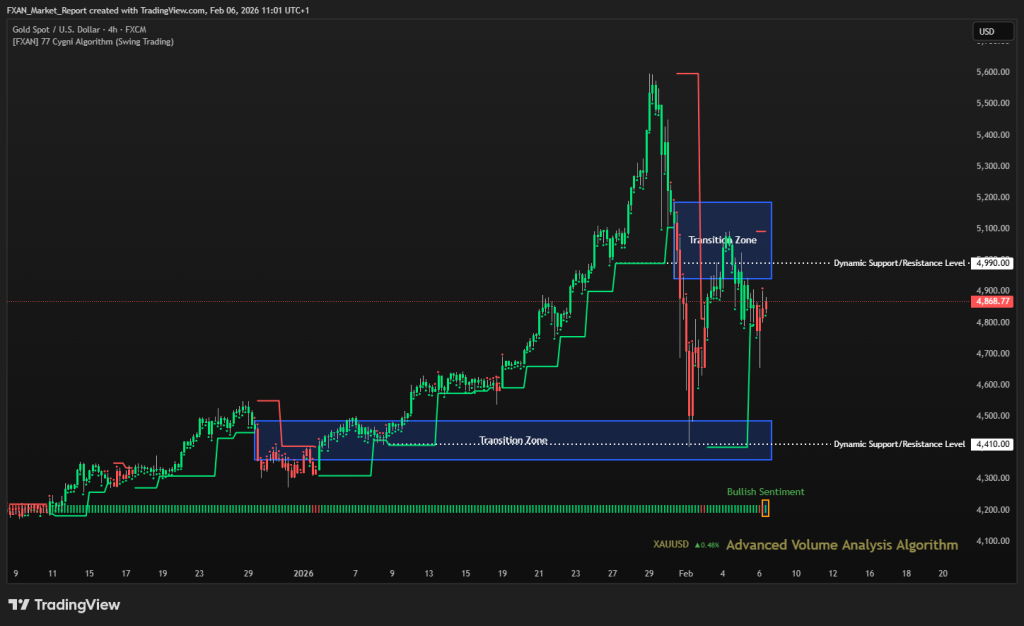
Bullish – XAU/USD maintains a bullish sentiment in the last hours despite the recent sharp correction from the highs. Price action shows buyers defending key lower levels, preventing deeper downside continuation. The broader structure remains constructive as long as price holds above major support. Short term volatility reflects consolidation rather than a full trend reversal.
🔹 Transition Zones:
4360 – 4485 – Bearish Transition Zone.
This lower transition zone represents a major accumulation base from which the broader bullish trend originated. Any deeper pullback into this area would likely be met with strong buyer interest and act as a long term structural support.
4940 – 5185 – Bearish Transition Zone.
The upper transition zone is acting as a supply area where price struggled to maintain acceptance. A sustained break and hold above this zone would confirm continuation of the broader bullish trend.
🔹 Dynamic Support/Resistance Levels:
This level is a key structural support and defines the lower boundary of bullish control. A decisive break below it would weaken the bullish bias and shift focus toward deeper corrective levels.
Price: 4990
This level is currently acting as near term resistance. Reclaiming and holding above it would signal renewed upside momentum and strengthen bullish continuation prospects.
🔹 Commentary:
The recent selloff appears corrective within a larger bullish framework rather than trend changing. Buyers have shown responsiveness near lower levels, suggesting ongoing demand. Price is currently compressing between support and resistance, indicating a potential volatility expansion ahead. A clear directional move out of this range will likely define the next phase for gold.
WTI (Crude Oil)
🔹 Overall Sentiment:
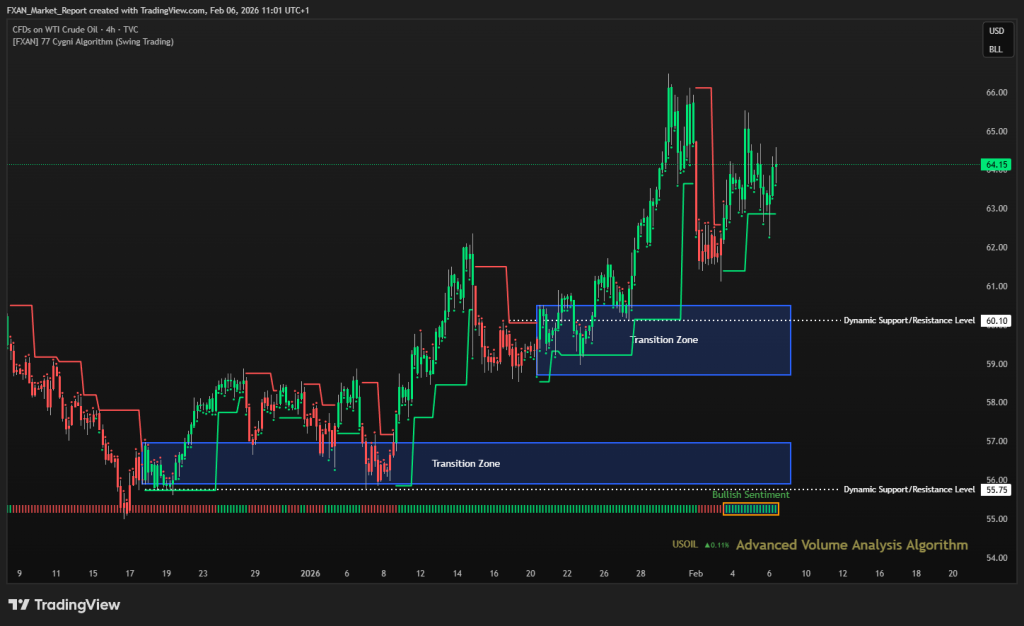
Bullish – by higher highs and higher lows on the intraday structure. Price remains firmly above key support areas, indicating sustained buying interest after the recent pullback. Momentum is constructive, although short term consolidation suggests the market is digesting recent gains. As long as price holds above structural support, the bullish bias remains intact.
🔹 Transition Zones:
55.90 – 56.95 – Bullish Transition Zone.
This lower transition zone represents a strong demand base where buyers previously stepped in aggressively. Any revisit into this area would likely be seen as a higher timeframe accumulation opportunity rather than a trend breakdown.
58.70 – 60.50 – Bullish Transition Zone.
The upper transition zone has acted as a key reaccumulation area before the latest push higher. Sustained acceptance above this zone confirms bullish control and keeps upside continuation in focus.
🔹 Dynamic Support/Resistance Levels:
Price: 55.75
This level marks a critical long term support and the foundation of the current bullish structure. A break below it would significantly weaken sentiment and shift the outlook toward a broader corrective phase.
Price: 60.10
This level is now acting as a dynamic support after the recent breakout. Holding above it reinforces bullish momentum, while a loss of this level could trigger a deeper pullback into the transition zone.
🔹 Commentary:
Price action suggests the recent dip was corrective rather than trend reversing. Buyers remain active on pullbacks, keeping volatility constructive and directional bias intact. The market is currently consolidating above former resistance turned support, a typical continuation behavior. A decisive breakout above recent highs would likely open the door for further upside expansion.
S&P 500
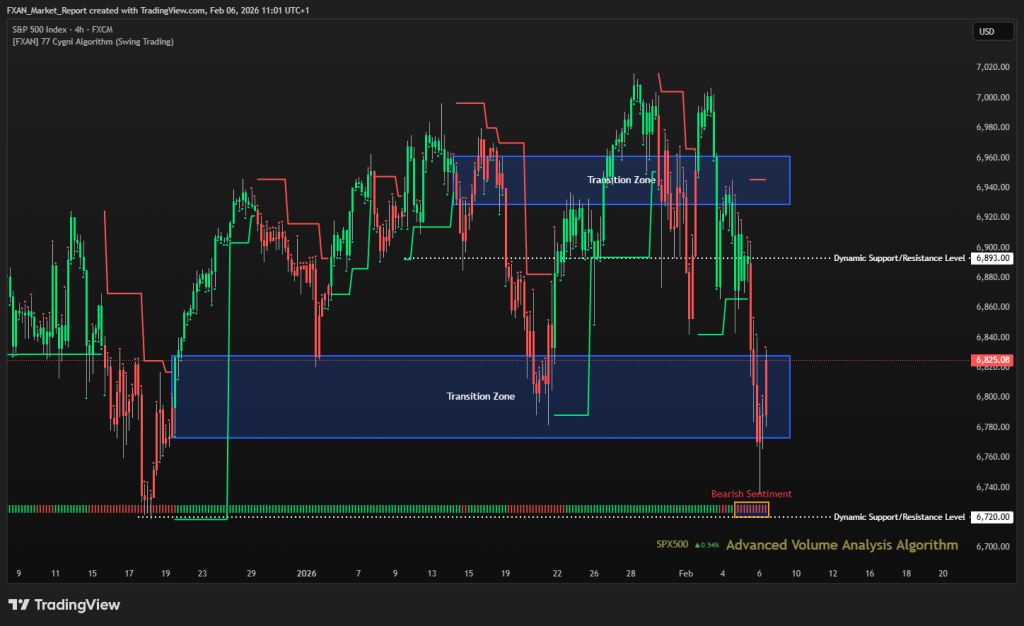
🔹 Overall Sentiment:
Bearish – The S&P 500 has shifted into a bearish sentiment over the last three days, with price breaking lower from recent highs and losing key structural support. Selling pressure has increased, and rebounds have been capped quickly, suggesting distribution rather than accumulation. The index is now trading below important resistance, keeping downside risks elevated. Unless price reclaims higher levels decisively, bearish control remains dominant.
🔹 Transition Zones:
6773 – 6828 – Bullish Transition Zone.
This transition zone is currently being tested and represents a critical short term decision area. Holding within this zone may lead to temporary stabilization, while sustained acceptance below it would reinforce further downside continuation.
6929 – 6961 – Bearish Transition Zone.
The upper transition zone marks a strong supply area where previous bullish attempts failed. Any move back into this zone would likely face heavy selling pressure and act as a ceiling for corrective rallies.
🔹 Dynamic Support/Resistance Levels:
Price: 6720
This level serves as a key downside reference and the next major support below current price. A clean break below 6720 would confirm bearish continuation and open the door for deeper declines.
Price: 6893
This level has flipped into dynamic resistance after the recent breakdown. As long as price remains below it, bearish momentum is expected to persist.
🔹 Commentary:
Recent price action reflects a clear shift from consolidation into downside expansion. Sellers are defending rallies aggressively, while buyers remain reactive rather than proactive. Volatility has increased on the downside, reinforcing bearish sentiment. A recovery would require strong acceptance back above resistance levels, otherwise the path of least resistance remains lower.
BTC/USD (Bitcoin)
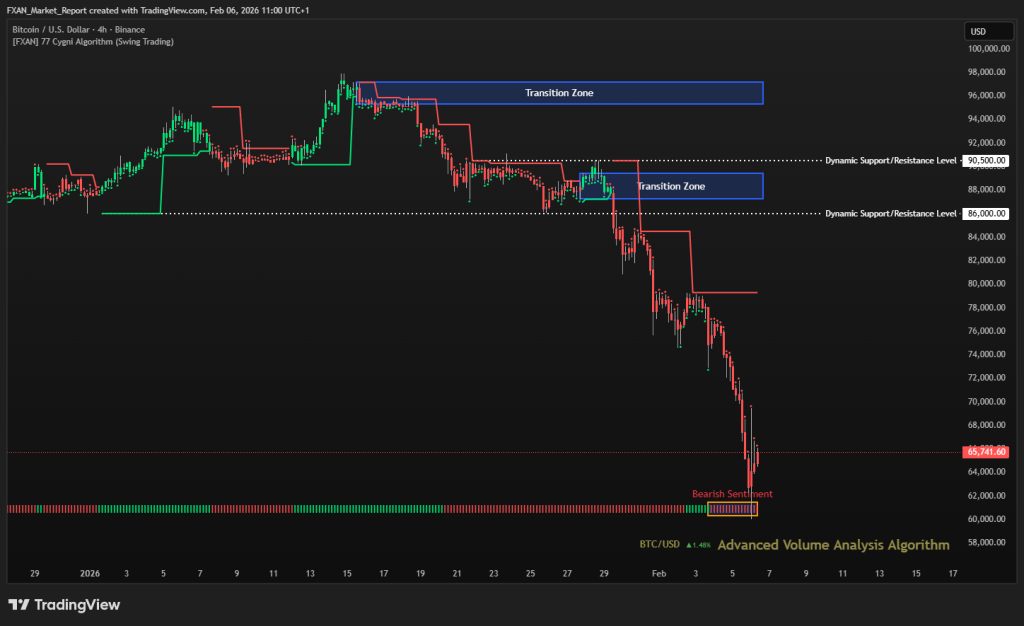
🔹 Overall Sentiment:
Bearish – BTC/USD remains firmly bearish over the last three days, with price accelerating lower and printing fresh breakdown levels. Selling pressure is dominant, and previous support areas have failed to hold, confirming strong bearish momentum. The lack of meaningful bullish reaction suggests sellers remain in control. As long as price stays below former value zones, downside continuation remains the higher probability scenario.
🔹 Transition Zones:
95,300 – 97,150 – Bearish Transition Zone.
This upper transition zone represents a major distribution area from earlier price action. Any recovery into this zone would likely face aggressive selling and act as a strong resistance cap.
87,250 – 89,400– Bullish Transition Zone.
The lower transition zone marks the last significant consolidation before the sharp breakdown. Price rejection from this area confirmed a bearish continuation and reinforced it as a key resistance region.
🔹 Dynamic Support/Resistance Levels:
Price: 88,200
This level has clearly flipped into resistance after the breakdown. As long as price remains below 86,000, bearish structure stays intact.
Price: 90,500
This level represents a higher timeframe resistance and aligns with prior bearish rejection points. A move back above it would be required to weaken the current bearish bias.
🔹 Commentary:
Market structure shows strong downside expansion with minimal corrective pullbacks. Momentum indicators and volume behavior continue to favor sellers. Any short term rebounds are currently corrective in nature rather than trend changing. Until price reclaims key resistance levels, BTC/USD remains vulnerable to further downside.