
EUR/USD
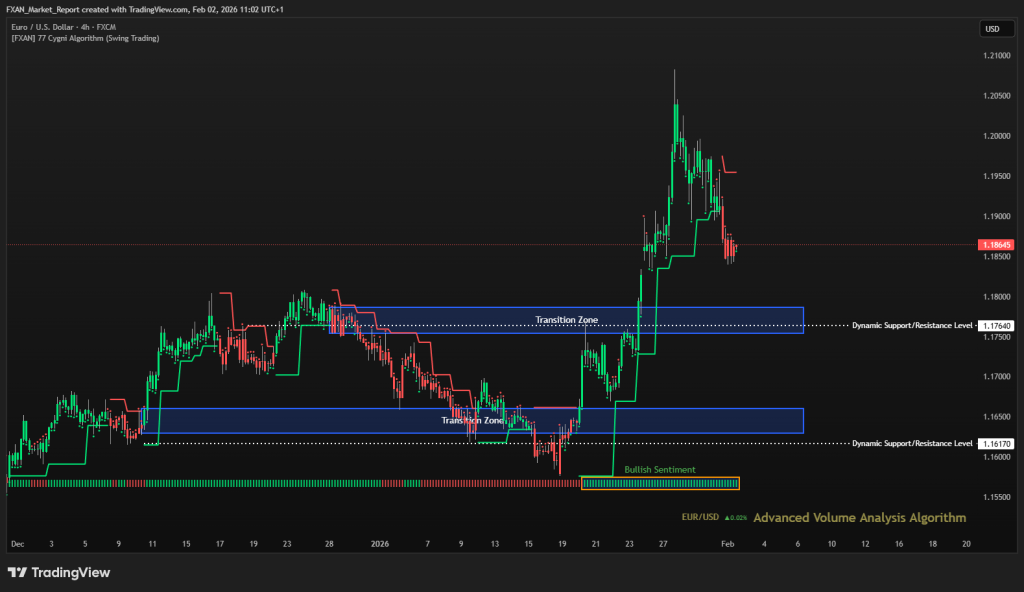
🔹 Overall Sentiment:
Bullish – EUR/USD maintains a bullish structure after more than a week of upside momentum, despite the recent pullback from highs. The broader trend remains constructive, supported by strong impulsive buying earlier in the move. Current price action suggests a corrective phase rather than a full trend reversal. Bullish bias remains valid as long as price holds above key structural support.
🔹 Transition Zones:
1.16300 to 1.16600 – Bullish Transition Zone.
This lower transition zone acted as a strong accumulation area that initiated the recent bullish impulse. Holding above this zone reinforces buyer control and supports continuation scenarios.
1.17540 to 1.17865 – Bearish Transition Zone.
The upper transition zone represents a prior resistance area where price faced rejection. A sustained acceptance above this zone would signal renewed bullish continuation and trend expansion.
🔹 Dynamic Support/Resistance Levels:
Price: 1.17640
This level currently acts as a key dynamic resistance following the recent rejection. A clean break and hold above it would confirm bullish continuation.
Price: 1.16170
This level serves as an important dynamic support and structural floor. A loss of this level would weaken the bullish outlook and suggest deeper corrective pressure.
🔹 Commentary:
The recent pullback appears corrective after a strong vertical rally rather than distribution. Market structure remains favorable for buyers as long as higher lows are preserved. Volume dynamics suggest profit taking rather than aggressive selling. Overall bias stays bullish while price holds above the lower transition zone.
GBP/USD
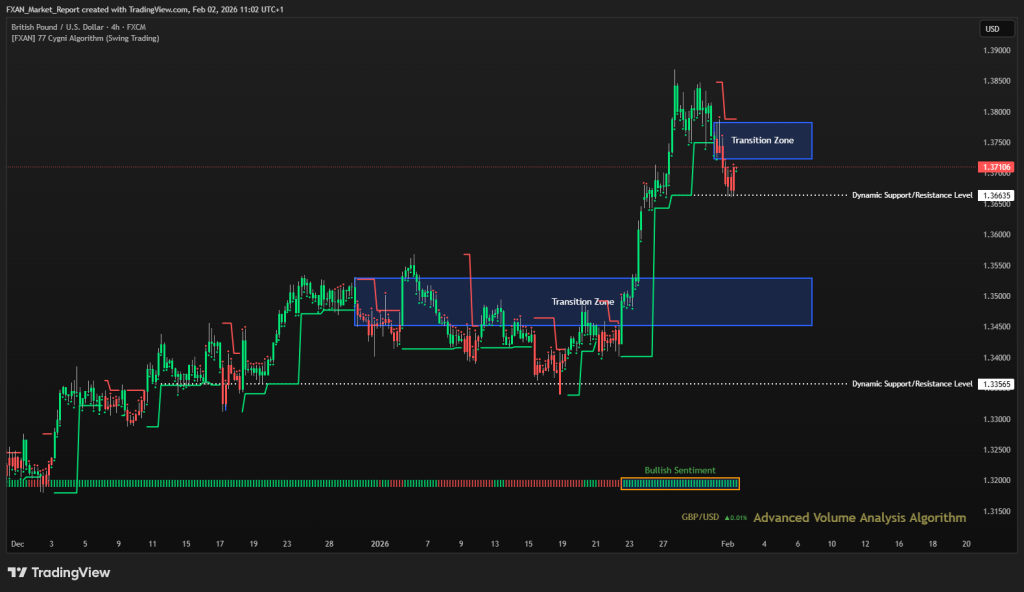
🔹 Overall Sentiment:
Bullish – GBP/USD remains in a bullish structure after more than a week of sustained upside momentum. The recent pullback from highs appears corrective following a strong impulsive rally. Market structure continues to favor buyers as higher lows are preserved. Bullish sentiment remains intact while price holds above key dynamic support.
🔹 Transition Zones:
1.34515 – 1.35285– Bearish Transition Zone.
This lower transition zone acted as a strong accumulation and base for the recent bullish expansion. Continued acceptance above this zone confirms underlying demand and medium term bullish control.
1.37230 – 1.37820– Bearish Transition Zone.
The upper transition zone marks an area of short term supply where price is currently reacting. A sustained break and hold above this zone would signal trend continuation and renewed bullish strength.
🔹 Dynamic Support/Resistance Levels:
Price: 1.33565
This level represents a major structural support within the broader bullish trend. A move below it would indicate a deeper corrective phase and weaken the current bullish outlook.
Price: 1.36635
This level is acting as immediate dynamic support after the recent pullback. Holding above it keeps the bullish structure intact and supports continuation scenarios.
🔹 Commentary:
The recent retracement is consistent with healthy profit taking rather than distribution. Volume behavior supports a corrective pause following aggressive upside expansion. Buyers remain in control as long as price consolidates above dynamic support. Overall market conditions continue to favor bullish continuation over trend reversal.
GOLD (XAU/USD)
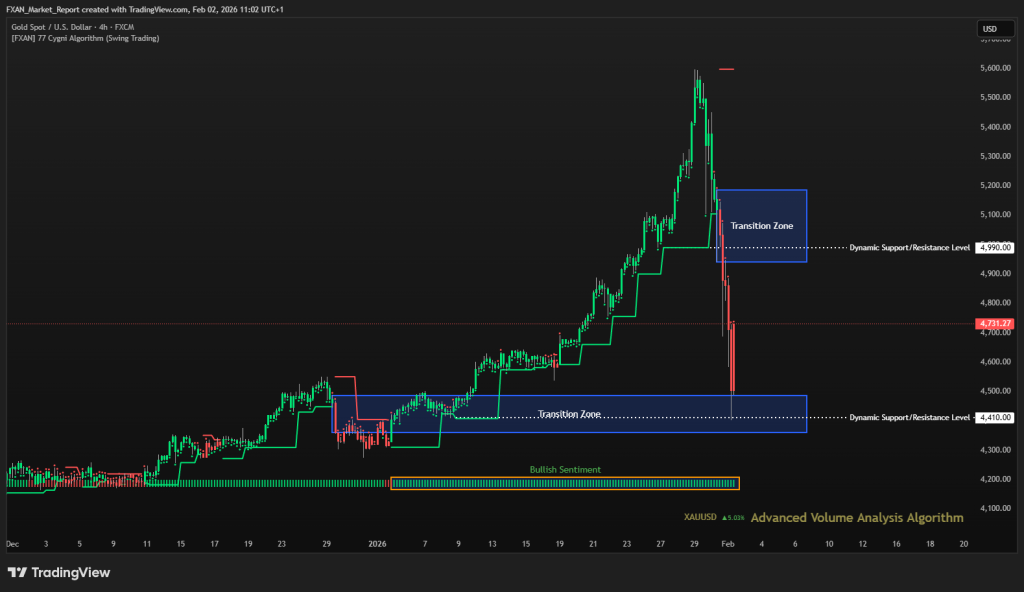
🔹 Overall Sentiment:
Bullish – XAU/USD remains in a broader bullish trend despite the sharp corrective move from recent highs. The strong upside impulse over the past three weeks confirms sustained buyer dominance. The current decline appears corrective rather than trend reversing. Bullish sentiment remains valid while price stabilizes above key structural support.
🔹 Transition Zones:
4360 – 4485 – Bearish Transition Zone.
This lower transition zone represents a major accumulation area from which the broader bullish trend originated. Sustained price acceptance above this zone reinforces long term bullish structure and downside protection.
4940 – 5185 – Bearish Transition Zone.
The upper transition zone marks a critical supply and volatility area following the recent parabolic advance. Price reaction within this zone suggests short term consolidation as the market digests gains.
🔹 Dynamic Support/Resistance Levels:
Price: 4410
This level acts as a key structural support within the broader trend. A decisive break below it would signal a deeper corrective phase and weaken the bullish outlook.
Price: 4990
This level is currently acting as immediate dynamic resistance after the sharp pullback. A reclaim and hold above it would indicate renewed bullish momentum and trend continuation.
🔹 Commentary:
The recent selloff reflects aggressive profit taking after an extended upside run. Volume dynamics support a corrective reset rather than distribution. Market structure remains constructive as long as higher timeframe supports hold. Overall conditions favor consolidation before the next directional move.
WTI (Crude Oil)
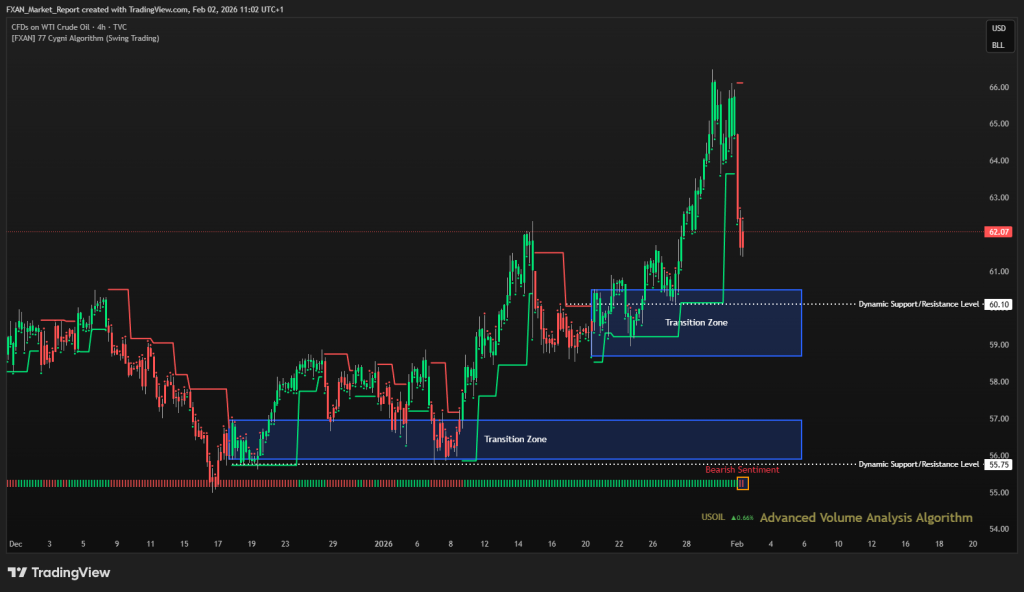
🔹 Overall Sentiment:
Bearish – WTI crude oil has shifted into a short term bearish sentiment following a strong rejection from recent highs. The latest downside move suggests profit taking and fading bullish momentum after an extended rally. Price is currently correcting back toward prior value areas. Bearish pressure dominates in the near term while price remains below key resistance.
🔹 Transition Zones:
55.90 – 56.95 – Bullish Transition Zone.
This lower transition zone represents a major demand and accumulation area from previous consolidation. A revisit into this zone would likely attract stronger buyer interest and slow the downside move.
58.70 – 60.50 – Bullish Transition Zone.
This zone acts as a key decision area where price previously built momentum before the breakout. Sustained trading below this zone confirms short term bearish control, while a reclaim would stabilize price action.
🔹 Dynamic Support/Resistance Levels:
Price: 55.75
This level is a critical structural support that defines the broader bullish framework. A clean break below it would significantly weaken the medium term outlook.
Price: 60.10
This level now acts as immediate resistance after the recent rejection. Failure to reclaim it keeps downside pressure active and favors further corrective movement.
🔹 Commentary:
The sharp pullback reflects exhaustion after the aggressive upside extension. Volume behavior supports a corrective phase rather than immediate trend reversal. Market structure suggests consolidation or deeper retracement before directional clarity returns. Short term conditions remain bearish while key resistance caps price.
S&P 500
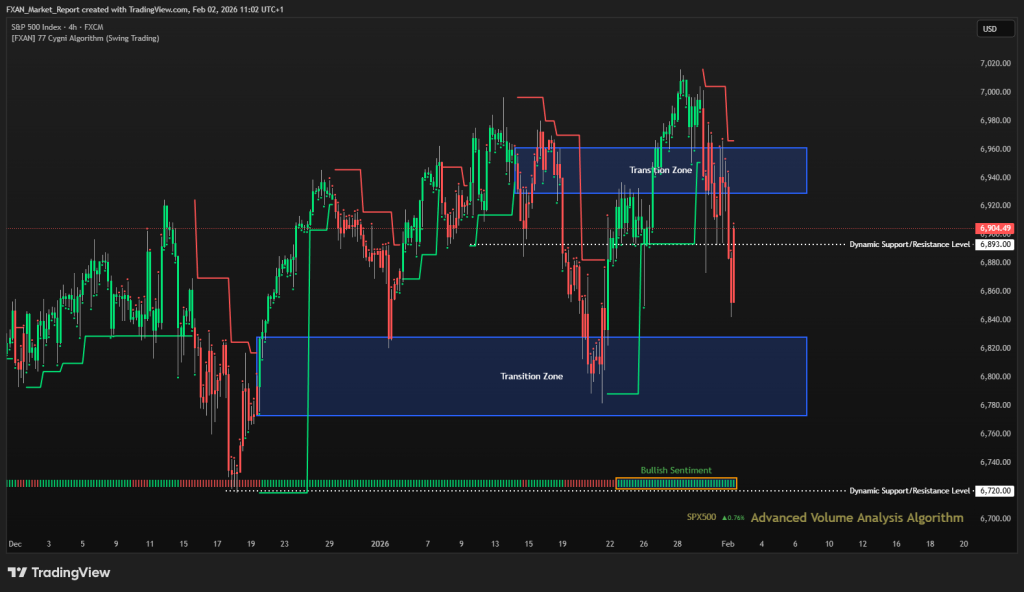
🔹 Overall Sentiment:
Bullish – The S&P 500 maintains a bullish sentiment despite the recent pullback from local highs. The broader structure remains constructive, with price still trading above key medium term support. Recent selling pressure appears corrective rather than trend reversing. As long as buyers defend critical support levels, the bullish bias stays intact.
🔹 Transition Zones:
6773 – 6828 – Bullish Transition Zone.
This lower transition zone represents a strong demand area where buyers previously stepped in aggressively. A retest of this zone would likely attract renewed buying interest and help stabilize price action.
6929 – 6961 – Bearish Transition Zone.
This upper transition zone acted as a supply area and capped recent upside momentum. Sustained acceptance above this zone would signal trend continuation, while rejection keeps short term volatility elevated.
🔹 Dynamic Support/Resistance Levels:
Price: 6720
This level serves as a major structural support within the broader bullish trend. A decisive break below it would weaken the current market structure significantly.
Price: 6893
This level is acting as a near term pivot and short term resistance. Reclaiming it would suggest fading bearish pressure and renewed upside momentum.
🔹 Commentary:
The recent decline reflects profit taking after an extended rally rather than aggressive distribution. Volume behavior supports a corrective phase within a broader uptrend. Price reaction around the transition zones will be key for directional clarity. Overall conditions still favor bullish continuation once consolidation resolves.
BTC/USD (Bitcoin)
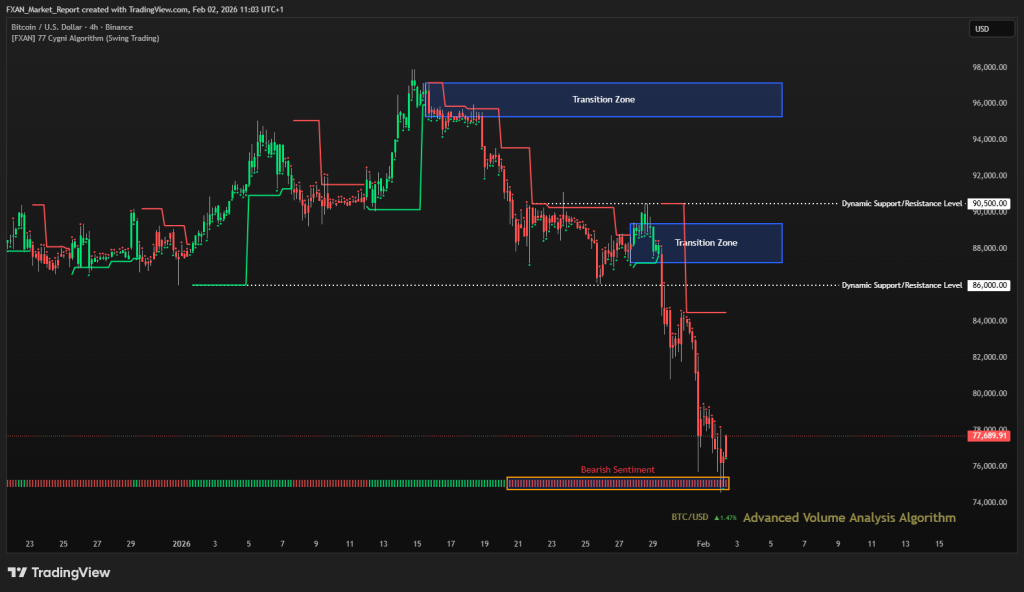
🔹 Overall Sentiment:
Bearish – BTC/USD remains under clear bearish sentiment, with sustained selling pressure dominating price action for almost two weeks. The market has broken below multiple key support areas, confirming a strong downside structure. Momentum remains firmly negative, and rebounds so far have been corrective in nature. As long as price stays below major resistance levels, the bearish bias remains intact.
🔹 Transition Zones:
95,300 – 97,150 – Bearish Transition Zone.
This upper transition zone marks a strong distribution area where sellers previously gained control. Any move back into this zone would likely face heavy resistance and renewed selling pressure.
87,250 – 89,400– Bullish Transition Zone.
This mid range transition zone previously acted as temporary support before breaking down decisively. If price revisits this area, it is expected to act as resistance rather than support.
🔹 Dynamic Support/Resistance Levels:
Price: 88,200
This level now acts as a critical resistance after the recent breakdown. Failure to reclaim it keeps downside momentum dominant.
Price: 93,600
This higher resistance level defines the boundary for any meaningful trend shift. Only a sustained move above it would weaken the current bearish structure.
🔹 Commentary:
The sharp selloff suggests aggressive distribution and limited dip buying interest. Volume dynamics continue to favor sellers, reinforcing downside continuation risk. Short term bounces are likely to remain corrective unless key resistance levels are reclaimed. Overall market conditions still point toward caution and continued bearish pressure.