
EUR/USD
🔹 Overall Sentiment:
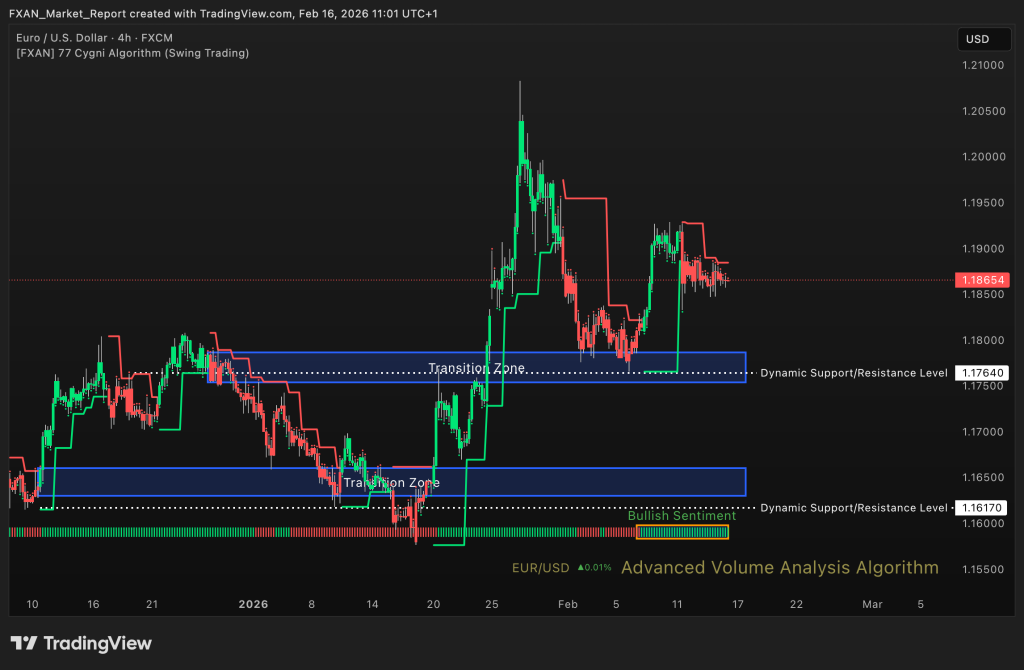
Bullish – EUR/USD maintains a bullish sentiment for more than a week, supported by a steady sequence of higher highs and higher lows. Price continues to trade comfortably above reclaimed support levels, reinforcing underlying strength. Pullbacks remain controlled and corrective rather than impulsive. The broader structure favors continuation to the upside while key supports hold.
🔹 Transition Zones:
1.16300 to 1.16600 – Bullish Transition Zone.
This zone represents a strong historical demand base that initiated the broader bullish expansion. It remains a major structural support in case of deeper retracements.
1.17540 to 1.17865 – Bearish Transition Zone.
Previously a resistance band, this zone has been successfully reclaimed by buyers. It now acts as a key support region reinforcing the bullish trend structure.
🔹 Dynamic Support/Resistance Levels:
Price: 1.17640
This level functions as immediate dynamic support within the current upward structure. Holding above it confirms continued buyer commitment.
Price: 1.16170
This deeper structural level acts as long term support. A sustained break below it would weaken the bullish outlook significantly.
🔹 Commentary:
Momentum remains constructive with dips attracting renewed buying interest. Volatility is moderate and aligned with trend continuation. Buyers continue defending higher support zones effectively. The bullish bias remains intact while price trades above dynamic support.
GBP/USD
🔹 Overall Sentiment:
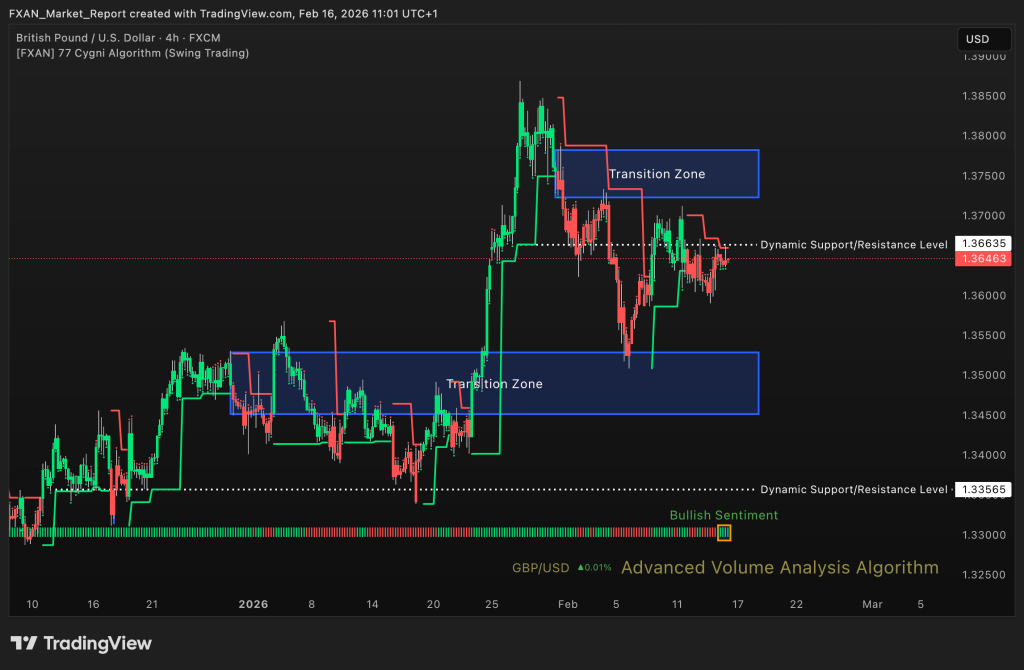
Bullish – GBP/USD shows bullish sentiment over the last day, reflecting renewed upside pressure. Price is attempting to stabilize after recent fluctuations and regain upward traction. Short term structure favors buyers as long as support levels are maintained. Momentum suggests potential continuation toward upper resistance zones.
🔹 Transition Zones:
1.34515 – 1.35285– Bearish Transition Zone.
This zone represents a strong support cluster from prior consolidation. It remains a downside cushion if corrective movement occurs.
1.37230 – 1.37820– Bearish Transition Zone.
This upper zone acts as a key resistance band. A clean break and acceptance above it would confirm broader bullish continuation.
🔹 Dynamic Support/Resistance Levels:
Price: 1.33565
This level marks major structural support below current price. It defines the boundary of the broader bullish framework.
Price: 1.36635
This level acts as near term resistance that price is attempting to challenge. Sustained trading above it would strengthen upside momentum.
🔹 Commentary:
Buyers are gradually regaining short term control. Price behavior shows resilience after minor pullbacks. Momentum indicators suggest constructive pressure building. The bullish outlook remains favored while higher lows continue forming.
GOLD (XAU/USD)
🔹 Overall Sentiment:
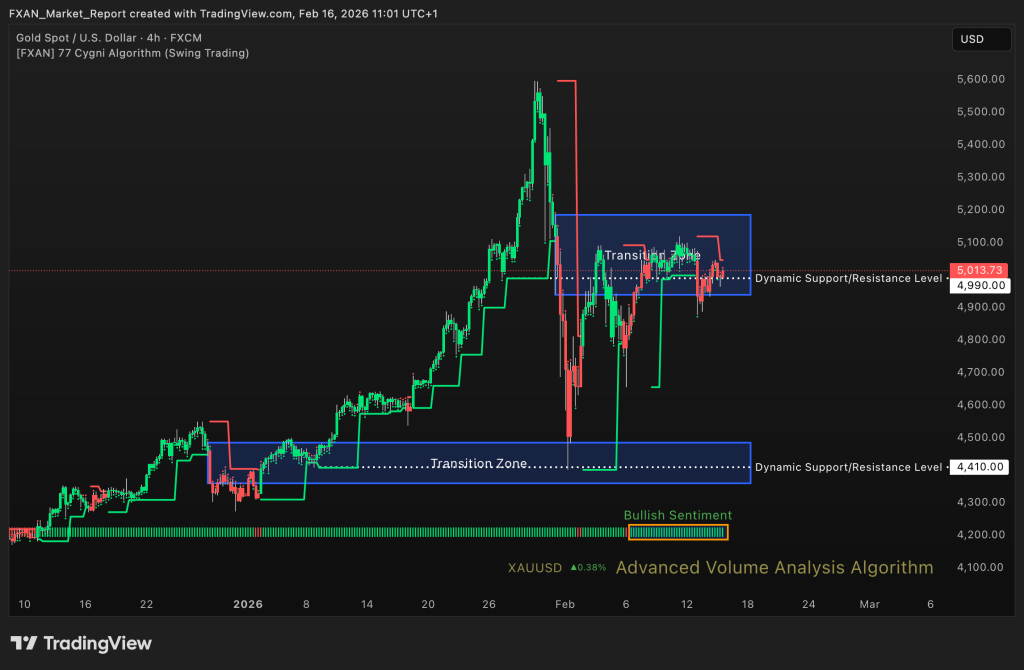
Bullish – Gold maintains bullish sentiment for the last two weeks, supported by strong upward structure and sustained demand. Despite intermittent volatility, the broader trend remains intact. Buyers continue defending pullbacks efficiently within established support regions. The overall bias favors continuation toward higher resistance levels.
🔹 Transition Zones:
4360 – 4485 – Bearish Transition Zone.
This zone represents a major accumulation base that fueled the broader rally. It remains the primary long term structural support.
4940 – 5185 – Bearish Transition Zone.
This zone defines the active trading range where price is currently operating. Sustained acceptance within or above this band supports continued bullish expansion.
🔹 Dynamic Support/Resistance Levels:
Price: 4410
This level aligns with long term structural protection for the trend. A break below would significantly weaken bullish momentum.
Price: 4990
This level acts as a near term pivot within the upper trading range. Holding above it reinforces short term bullish strength.
🔹 Commentary:
Gold continues to display strong underlying demand. Pullbacks are being absorbed quickly without structural breakdown. Momentum remains aligned with the broader upward move. The bullish bias persists while price stays above dynamic support.
WTI (Crude Oil)
🔹 Overall Sentiment:
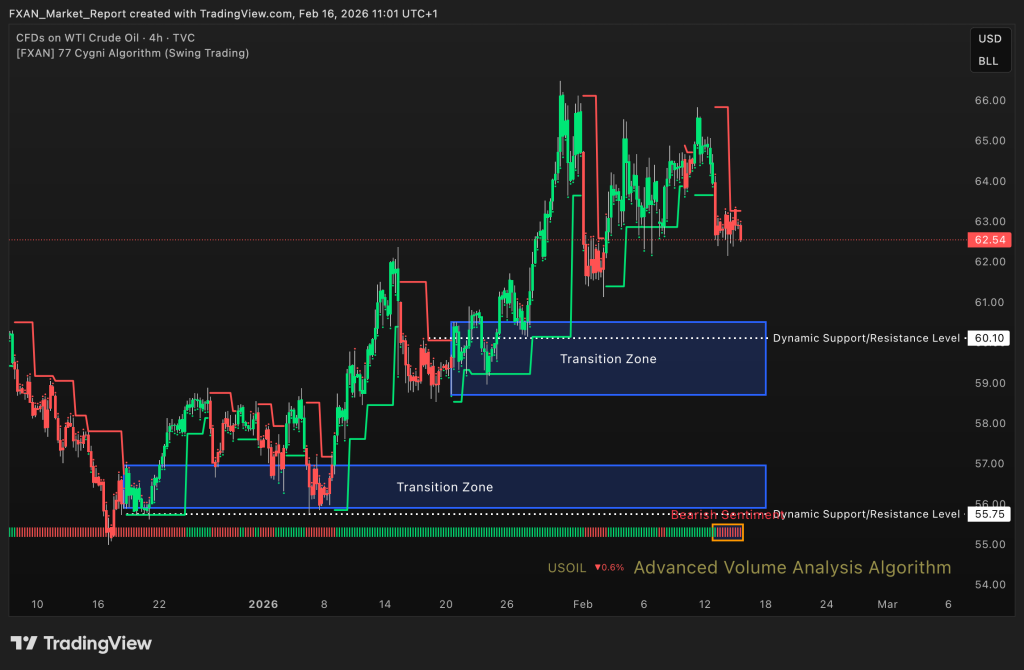
Bearish – WTI maintains bearish sentiment for the last four days, reflecting sustained selling pressure. Price struggles to hold above reclaimed support areas. Lower highs are forming, suggesting weakening upside attempts. The short term structure favors continued corrective downside.
🔹 Transition Zones:
55.90 – 56.95 – Bullish Transition Zone.
This lower zone represents a significant historical demand area. It could serve as a downside target if bearish pressure continues.
58.70 – 60.50 – Bullish Transition Zone.
This zone previously acted as consolidation support and now functions as resistance. Rejections from this region confirm seller dominance.
🔹 Dynamic Support/Resistance Levels:
Price: 55.75
This level marks major structural support beneath current price. A decisive break below would open further downside potential.
Price: 60.10
This level acts as dynamic resistance above current price. Remaining below it maintains the bearish bias.
🔹 Commentary:
Oil remains under pressure with limited bullish recovery strength. Price behavior suggests distribution rather than accumulation. Selling activity increases on rallies. Bearish momentum persists while price trades under resistance levels.
S&P 500
🔹 Overall Sentiment:
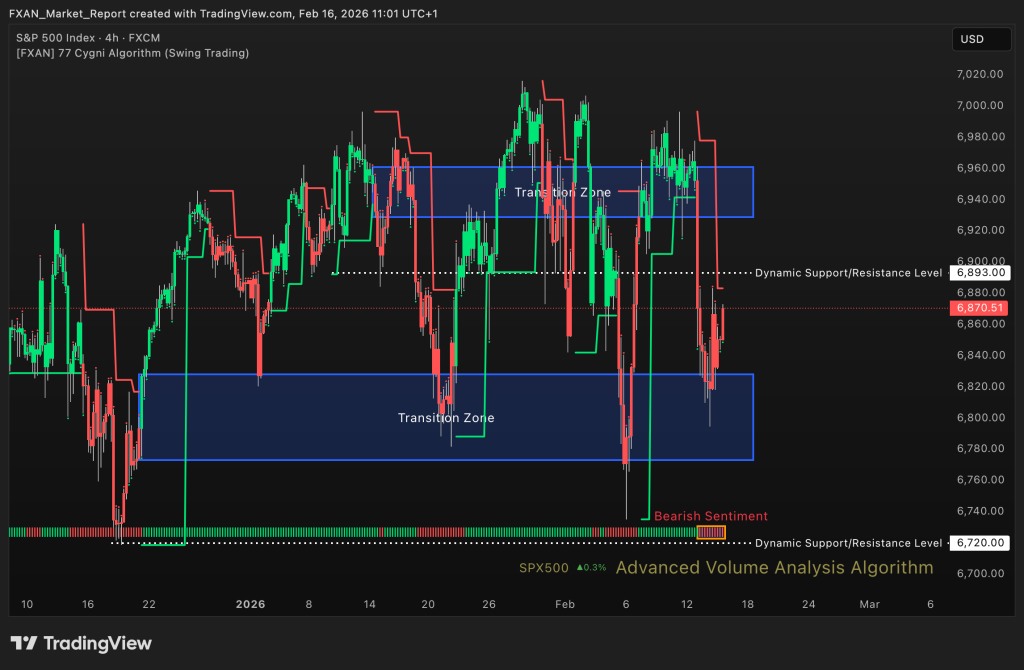
Bearish – The S&P 500 shows bearish sentiment over the last week, with increased downside volatility. Price has struggled to reclaim prior support turned resistance areas. Sellers remain active on rebounds, limiting upside continuation. The short term structure favors cautious positioning.
🔹 Transition Zones:
6773 – 6828 – Bullish Transition Zone.
This zone represents a key support cluster that is currently under pressure. Sustained trading below it confirms continued bearish control.
6929 – 6961 – Bearish Transition Zone.
This upper zone acts as strong resistance following prior rejection. Bulls must reclaim this area to shift momentum back upward.
🔹 Dynamic Support/Resistance Levels:
Price: 6720
This level marks critical structural support below current price. A breakdown beneath it would accelerate downside risk.
Price: 6893
This level functions as near term resistance. Staying below it maintains short term bearish pressure.
🔹 Commentary:
Equity markets show signs of distribution and hesitation. Recovery attempts lack sustained follow through. Volatility remains elevated compared to prior bullish phases. The bearish bias remains intact while resistance levels cap upside movement.
BTC/USD (Bitcoin)
🔹 Overall Sentiment:
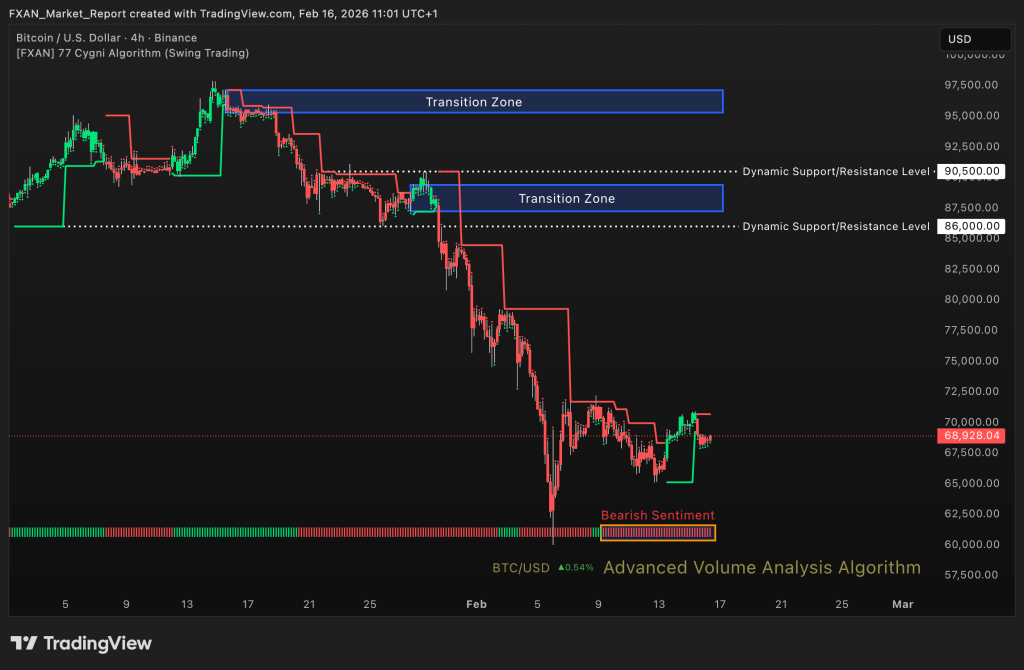
Bearish – BTC/USD continues to display bearish sentiment for the last eight days, characterized by sustained downward pressure. Lower highs and weak recovery attempts confirm seller dominance. Momentum remains negative within the short to medium term structure. The broader outlook favors caution while below key resistance levels.
🔹 Transition Zones:
95,300 – 97,150 – Bearish Transition Zone.
This zone represents a major distribution region from previous highs. It remains a strong long term resistance ceiling.
87,250 – 89,400– Bullish Transition Zone.
This zone previously served as consolidation before breakdown. It now functions as significant resistance on any recovery attempt.
🔹 Dynamic Support/Resistance Levels:
Price: 88,200
This level has turned into structural resistance after breakdown. Sustained trading below it reinforces bearish continuation.
Price: 90,500
This higher level marks key structural resistance. A move above it would be required to shift the broader bias.
🔹 Commentary:
Bitcoin remains under consistent selling pressure. Short term bounces appear corrective rather than impulsive. Market structure reflects ongoing distribution. Downside risk remains elevated while price trades beneath major resistance zones.