
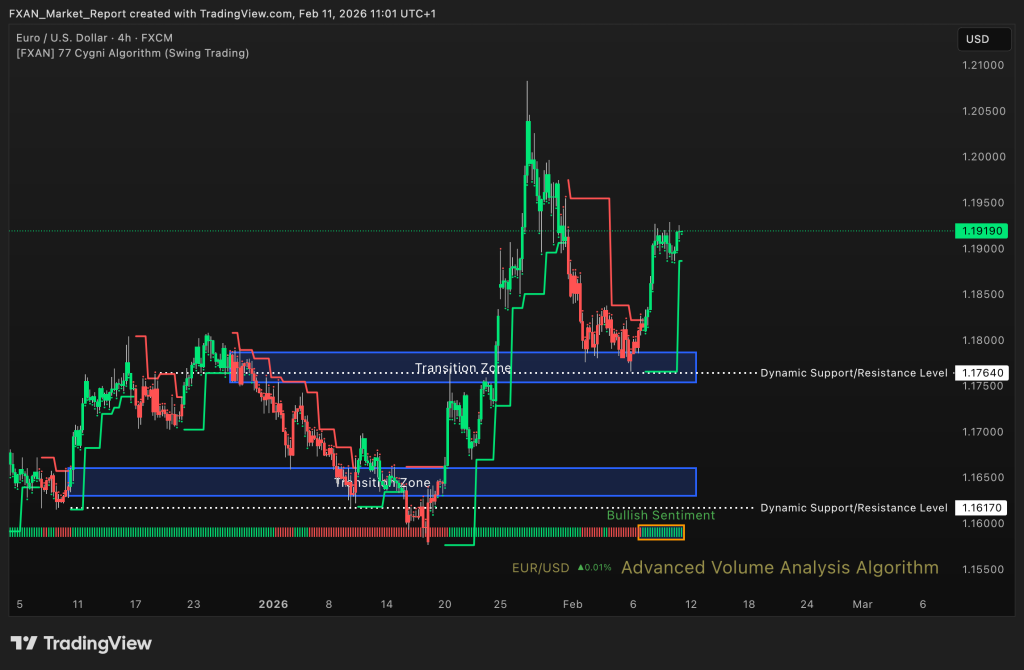
EUR/USD
🔹 Overall Sentiment:
Bullish – EUR/USD has maintained a bullish sentiment over the last week, supported by consistent higher highs and higher lows. Price action continues to show strong buyer commitment above prior breakout zones. Momentum remains firm with limited downside follow through on pullbacks. The broader structure favors continuation to the upside while key supports hold.
🔹 Transition Zones:
1.16300 to 1.16600 – Bullish Transition Zone.
This zone represents a major accumulation base from previous consolidation phases. It remains a strong structural demand area and a key reference point for the broader bullish trend.
1.17540 to 1.17865 – Bearish Transition Zone.
This zone previously acted as resistance before being reclaimed by buyers. It now serves as a higher value support region reinforcing bullish continuation.
🔹 Dynamic Support/Resistance Levels:
Price: 1.17640
This level acts as an important short term support within the current bullish structure. Holding above it confirms ongoing upside strength.
Price: 1.16170
This level represents deeper structural support. A break below it would weaken the medium term bullish outlook.
🔹 Commentary:
Price remains well supported by strong demand dynamics. Pullbacks are being absorbed quickly, showing underlying strength. Momentum conditions suggest continuation rather than exhaustion. As long as the pair trades above reclaimed zones, bullish bias remains dominant.
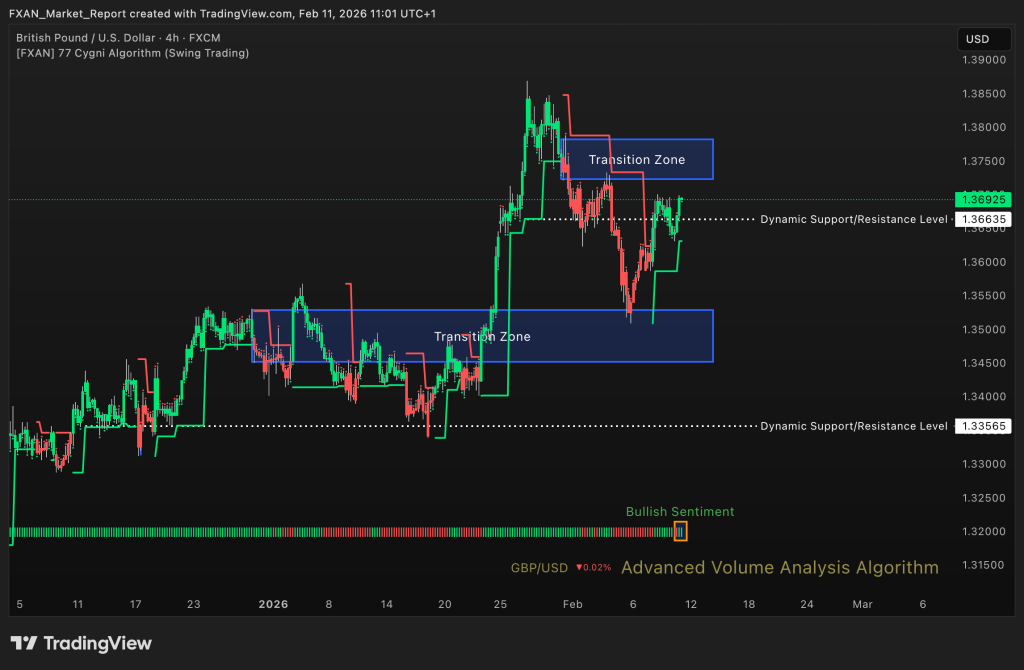
GBP/USD
🔹 Overall Sentiment:
Bullish – GBP/USD shows bullish sentiment over the last day with strong upward momentum. Buyers have regained control following recent consolidation. Price structure supports continuation toward higher resistance levels. Short term pullbacks appear corrective rather than trend reversing.
🔹 Transition Zones:
1.34515 – 1.35285– Bearish Transition Zone.
This zone represents a strong historical support base. It continues to act as a structural foundation for the broader up trend.
1.37230 – 1.37820– Bearish Transition Zone.
This zone is the next major resistance cluster above current price. A sustained breakout above this region would confirm further bullish expansion.
🔹 Dynamic Support/Resistance Levels:
Price: 1.33565
This level marks long term structural support. Holding above it preserves the broader bullish structure.
Price: 1.36635
This level is functioning as near term support within the current advance. Stability above it reinforces buyer control.
🔹 Commentary:
Momentum remains constructive with buyers pressing price higher. Volatility is controlled and orderly within the trend. The structure favors further upside testing of resistance. Bulls remain in control while price stays above key supports.
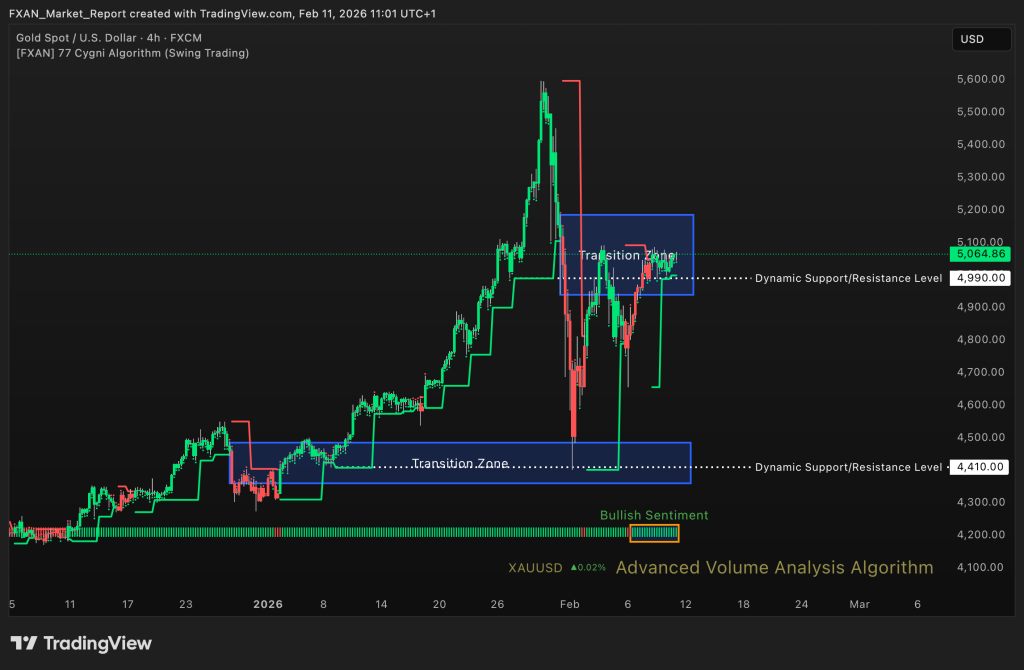
GOLD (XAU/USD)
🔹 Overall Sentiment:
Bullish – Gold maintains a bullish sentiment for almost a week, supported by strong impulsive advances. Price action shows consistent buying interest on retracements. Trend structure remains clearly upward. Buyers continue to dominate despite short term volatility.
🔹 Transition Zones:
4360 – 4485 – Bearish Transition Zone.
This lower zone represents a major long term accumulation region. It remains a strong structural support base for the broader bullish trend.
4940 – 5185 – Bearish Transition Zone.
This upper zone represents the active trading range where price is currently fluctuating. It acts as a value area between consolidation and potential breakout continuation.
🔹 Dynamic Support/Resistance Levels:
Price: 4410
This level aligns with major structural support. A move below it would significantly weaken the bullish framework.
Price: 4990
This level functions as a near term pivot within the current range. Sustained price above it supports further upside momentum.
🔹 Commentary:
Gold continues to attract strong buying interest on dips. Momentum remains elevated and trend structure is intact. Volatility suggests active participation rather than distribution. Bullish continuation remains favored while price holds above dynamic support.
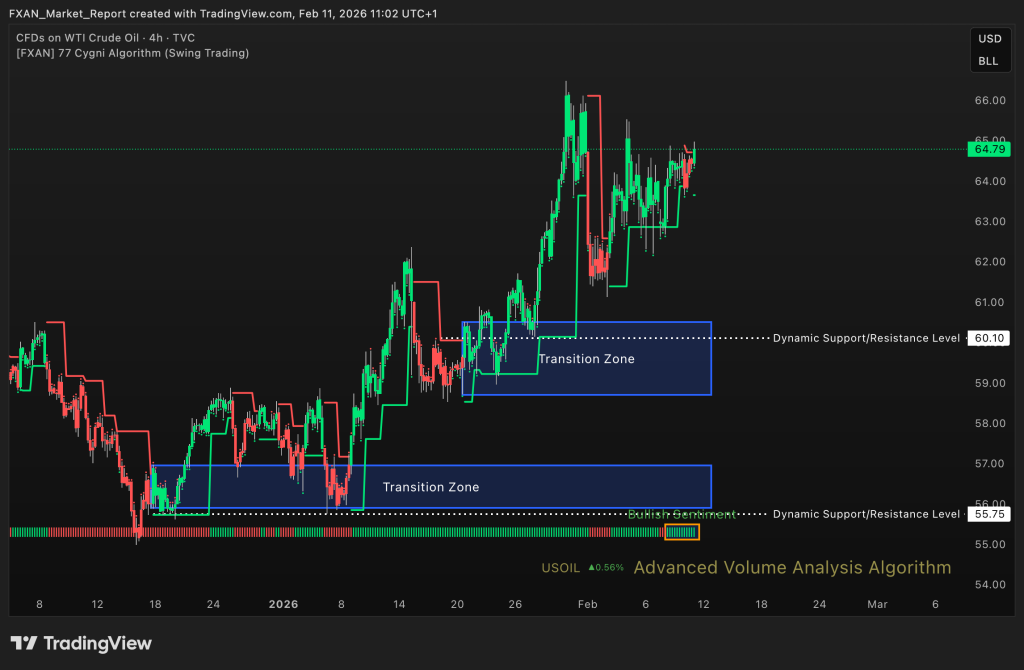
WTI (Crude Oil)
🔹 Overall Sentiment:
Bullish – WTI has displayed bearish sentiment over the last five days despite short term rebounds. Price structure shows lower highs forming within the broader move. Selling pressure remains present at key resistance levels. The short term bias leans toward further downside unless strength improves.
🔹 Transition Zones:
55.90 – 56.95 – Bullish Transition Zone.
This lower zone represents a strong historical demand region. It may act as a downside magnet if bearish pressure accelerates.
58.70 – 60.50 – Bullish Transition Zone.
This zone previously acted as consolidation support and now serves as resistance. Sellers may defend this region if price retraces higher.
🔹 Dynamic Support/Resistance Levels:
Price: 55.75
This level is a major downside support. A break below would confirm deeper bearish continuation.
Price: 60.10
This level acts as short term resistance after prior breakdown. Price needs sustained acceptance above it to neutralize bearish bias.
🔹 Commentary:
Oil remains vulnerable despite intermittent rebounds. The market shows signs of distribution rather than accumulation. Upside attempts lack strong follow through. Sellers maintain short term control below resistance levels.
S&P 500
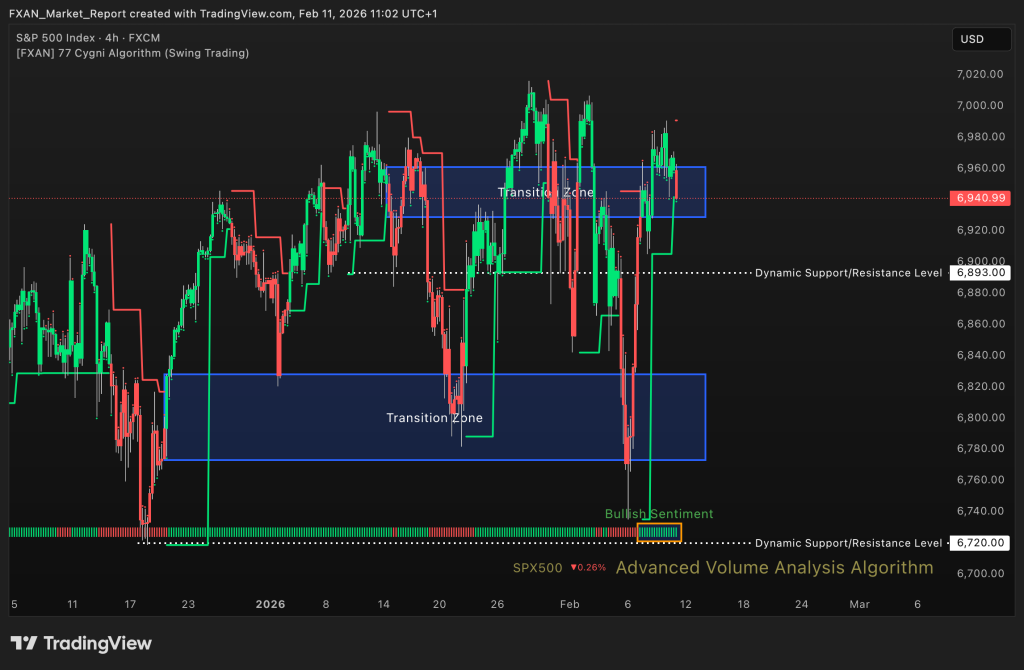
🔹 Overall Sentiment:
Bullish – The S&P 500 maintains a bullish sentiment for almost a week with steady upward momentum. Price continues to form higher lows, supporting the broader uptrend. Buyers remain active on pullbacks. Overall structure favors continued upside while support levels hold.
🔹 Transition Zones:
6773 – 6828 – Bullish Transition Zone.
This lower transition zone represents a key support cluster from prior consolidation. It serves as a strong demand base within the trend.
6929 – 6961 – Bearish Transition Zone.
This upper zone is an important resistance region near recent highs. A sustained breakout above it would signal further bullish expansion.
🔹 Dynamic Support/Resistance Levels:
Price: 6720
This level marks major structural support. Holding above it preserves the overall bullish outlook.
Price: 6893
This level is functioning as near term support within the current advance. Stability above it strengthens bullish continuation.
🔹 Commentary:
Equities continue to show resilience with constructive price behavior. Pullbacks remain shallow and controlled. Momentum conditions remain supportive of higher prices. Bulls retain dominance while price remains above key dynamic support.
BTC/USD (Bitcoin)
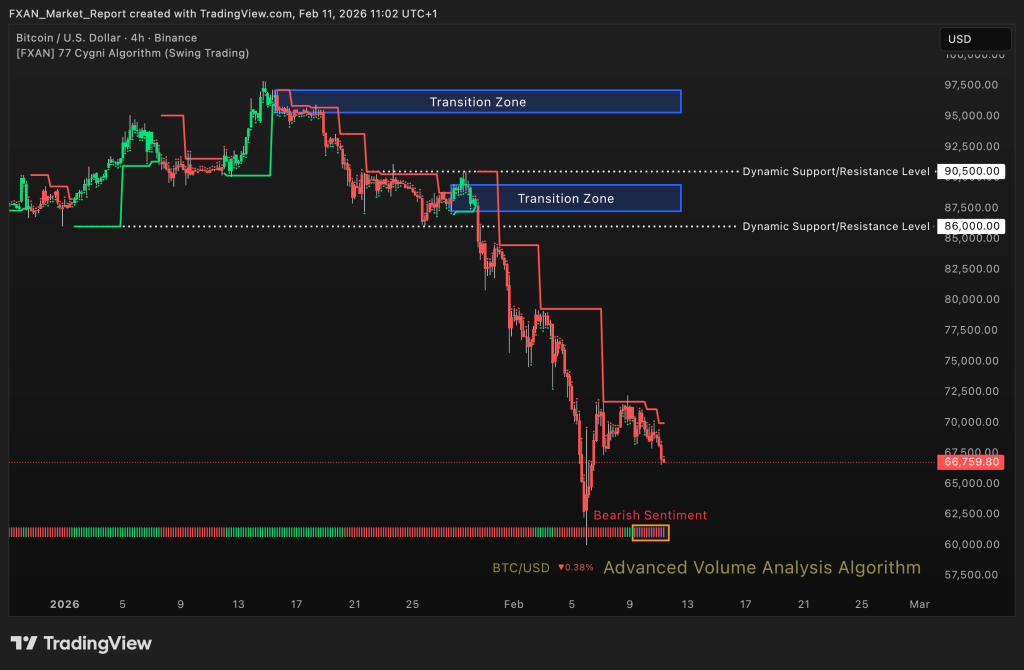
🔹 Overall Sentiment:
Bearish – BTC/USD has shown bearish sentiment over the last few days with sustained downside pressure. Price structure reflects lower highs and weak recovery attempts. Selling momentum remains dominant. The broader bias remains negative below major resistance zones.
🔹 Transition Zones:
95,300 – 97,150 – Bearish Transition Zone.
This upper zone represents a major distribution area. Any rally toward this region is likely to encounter heavy resistance.
87,250 – 89,400– Bullish Transition Zone.
This zone previously acted as consolidation before breakdown. It now functions as a strong resistance barrier.
🔹 Dynamic Support/Resistance Levels:
Price: 88,200
This level has turned into resistance after prior breakdown. Price remaining below it confirms bearish continuation.
Price: 90,500
This higher level represents key structural resistance. A sustained move above it would be required to shift bias.
🔹 Commentary:
Bitcoin continues to struggle under persistent selling pressure. Recovery attempts lack momentum and follow through. Market structure remains weak below reclaimed resistance zones. Downside risk stays elevated while price trades under key levels.