
EUR/USD
🔹 Overall Sentiment:
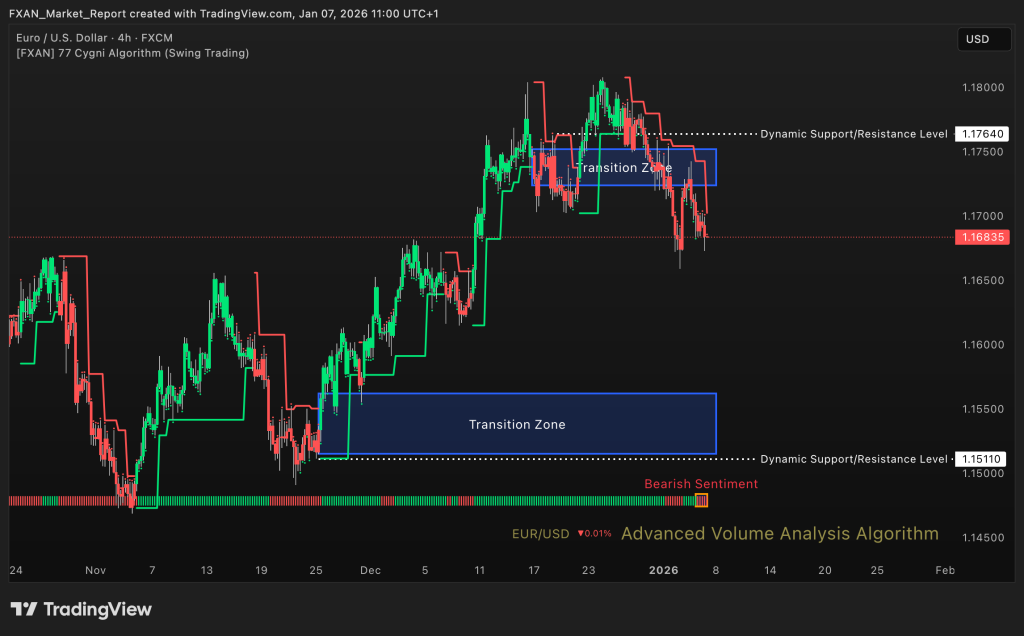
Bearish – EUR/USD has shifted into a bearish sentiment over the last day, with price rolling over after failing to sustain gains near recent highs. Selling pressure has increased below the upper resistance area, leading to a steady downside rotation. The short term structure now favors sellers, with lower highs forming on intraday moves. As long as price remains capped below resistance, downside risk remains active.
🔹 Transition Zones:
1.15150 – 1.15620 – Bullish Transition Zone.
This lower transition zone represents a key demand area where buyers previously stepped in with strength. A move into this zone could slow bearish momentum and trigger a corrective bounce, though sustained buying would be required to shift sentiment.
1.17240 – 1.17520 – Bearish Transition Zone.
This upper transition zone acts as a strong supply area and has recently rejected price. Failure to reclaim this zone confirms it as resistance and reinforces the current bearish bias.
🔹 Dynamic Support/Resistance Levels:
Price: 1.15110
Level 1 at 1.15110 functions as an important dynamic support aligned with the lower transition zone. A decisive break below this level would expose further downside potential.
Price: 1.17640
Level 2 at 1.17640 serves as dynamic resistance, and continued rejection here maintains seller control. A sustained break above this level would be required to weaken the bearish outlook.
🔹 Commentary:
Price is currently trading below the upper transition zone, indicating controlled bearish momentum. Selling pressure appears steady rather than aggressive, suggesting continuation through structure rather than a sharp sell off. Any short term bullish attempts are likely to be corrective while below resistance. Traders should closely monitor reactions around dynamic support for confirmation of continuation or stabilization.
GBP/USD
🔹 Overall Sentiment:
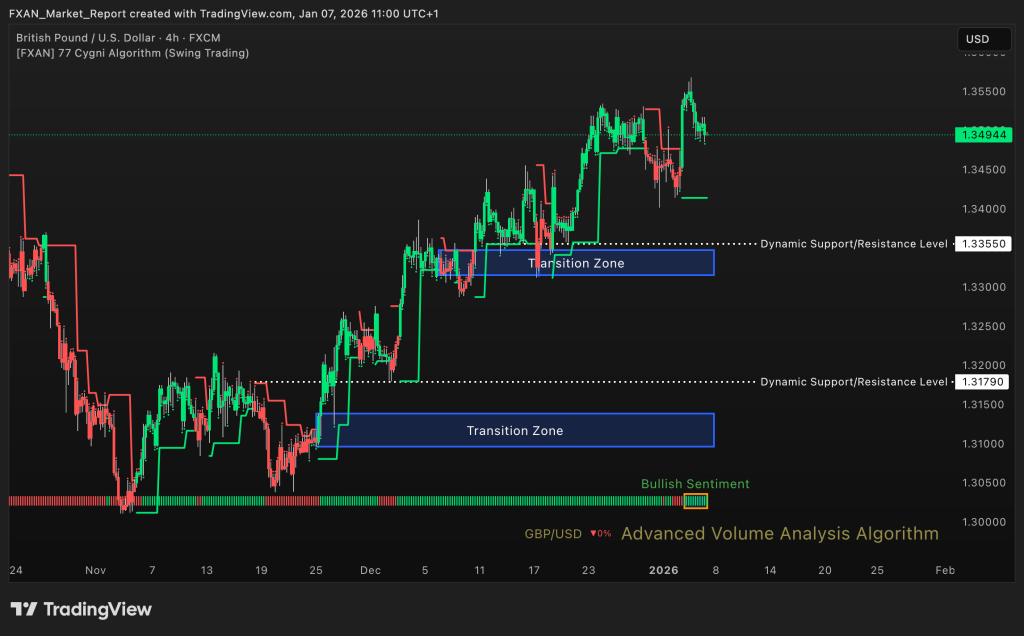
Bullis – GBP/USD has maintained a bullish sentiment over the last two days, supported by strong upside continuation and consistent higher highs. Buyers remain in control, with price holding comfortably above key support levels. Pullbacks have been shallow and quickly absorbed, highlighting sustained demand. As long as price remains above structural support, the bullish bias remains intact.
🔹 Transition Zones:
1.30960 – 1.31380– Bullish Transition Zone.
This lower transition zone represents a major demand area where buyers previously entered aggressively. A deeper retracement into this zone would likely attract renewed buying interest and help preserve the broader bullish structure.
1.33150 – 1.33470– Bearish Transition Zone.
This upper transition zone has transitioned into a key support area following the recent breakout. Holding above this zone confirms bullish strength, while a failure to hold could open the door for a deeper corrective move.
🔹 Dynamic Support/Resistance Levels:
Price: 1.31790
Level 1 at 1.31790 functions as a strong dynamic support aligned with the lower transition zone. A sustained break below this level would signal a potential shift toward a corrective phase.
Price: 1.33550
Level 2 at 1.33550 serves as an important dynamic support that has recently been defended. Maintaining price above this level keeps upside momentum intact.
🔹 Commentary:
Price is currently consolidating above the upper transition zone, suggesting healthy bullish continuation rather than exhaustion. Momentum remains constructive, with buyers stepping in on minor pullbacks. Any short term consolidation above dynamic support would be viewed as a continuation pattern. Traders should monitor reactions around key support levels for confirmation of sustained upside or early signs of deeper correction.
GOLD (XAU/USD)
🔹 Overall Sentiment:
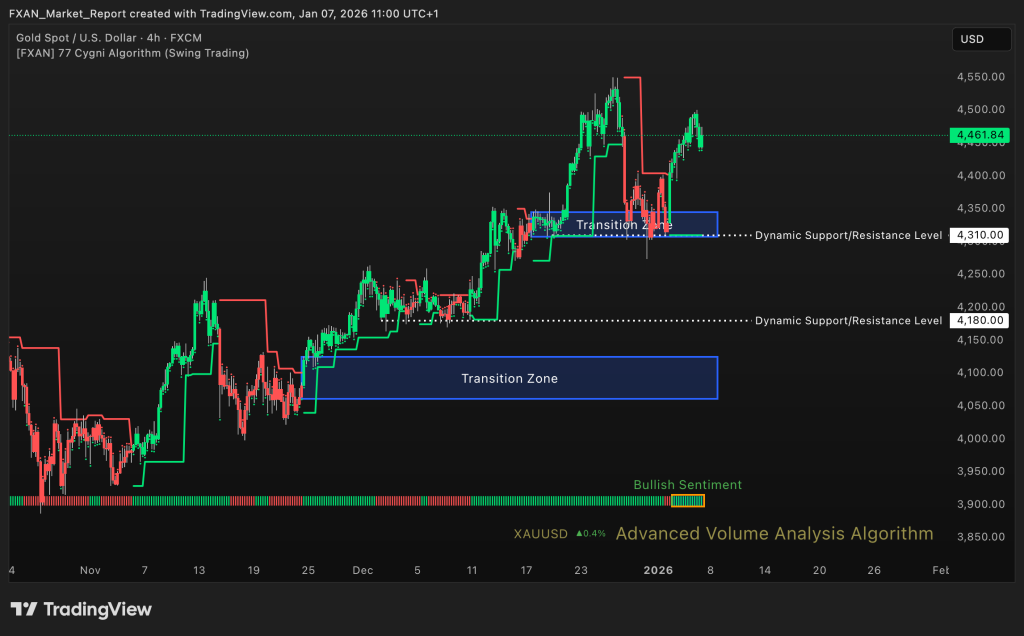
Bullish – XAU/USD has maintained a bullish sentiment over the last three days, supported by strong upside continuation and firm buyer control. Price has recovered quickly from recent pullbacks and continues to hold above key structural support. Momentum remains constructive, with higher lows forming on intraday price action. As long as price stays above major support, the bullish outlook remains valid.
🔹 Transition Zones:
4061 – 4125 – Bullish Transition Zone.
This lower transition zone represents a major demand area where buyers previously entered aggressively. A deeper retracement into this zone would likely attract strong buying interest and help reinforce the broader bullish structure.
4308 – 4345 – Bullish Transition Zone.
This upper transition zone has acted as a key decision area and recently provided support during consolidation. Holding above this zone confirms bullish strength, while a sustained break below could trigger a deeper corrective move toward lower support.
🔹 Dynamic Support/Resistance Levels:
Price: 4180
Level 1 at 4180 functions as an important dynamic support within the broader bullish trend. A decisive break below this level would signal weakening momentum and increase downside risk.
Price: 4310
Level 2 at 4310 serves as a short term dynamic support that has been actively defended. Maintaining price above this level keeps bullish momentum intact.
🔹 Commentary:
Price is currently trading well above the upper transition zone, highlighting strong bullish intent. Buyers continue to step in on pullbacks, suggesting confidence in trend continuation. Any short term consolidation above dynamic support would be considered healthy within the uptrend. Traders should monitor reactions near key support levels for confirmation of continuation or early signs of a corrective phase.
WTI (Crude Oil)
🔹 Overall Sentiment:
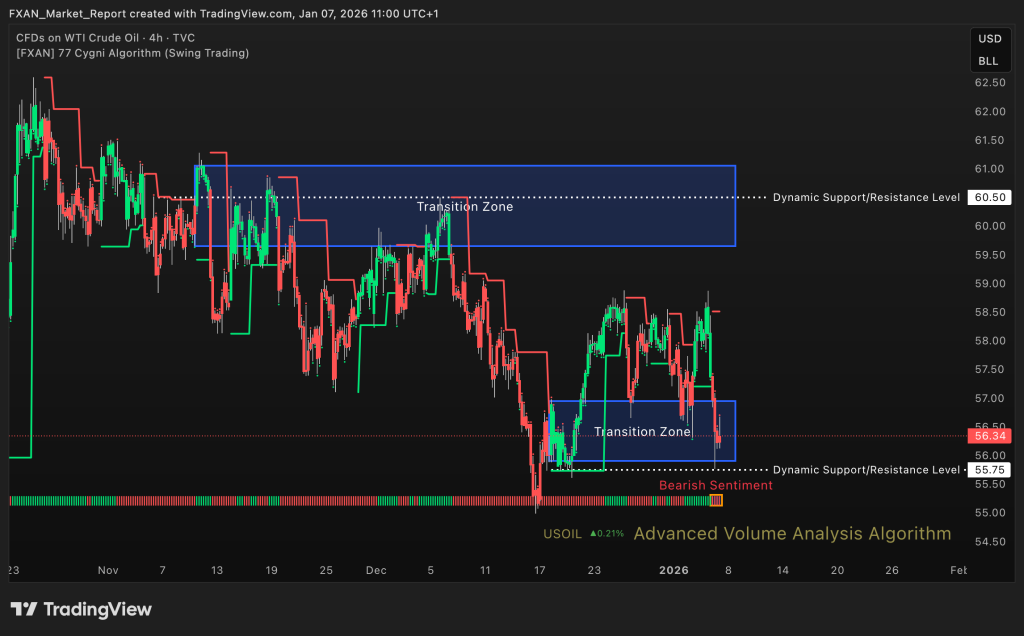
Bearish – WTI Crude Oil has shifted into a bearish sentiment over the last day, with price remaining under sustained selling pressure. Attempts to recover have been limited, indicating weak buyer participation. The short term structure continues to favor sellers while price trades below key resistance. Unless price can reclaim higher levels, downside risk remains present.
🔹 Transition Zones:
59.65 – 61.05 – Bullish Transition Zone.
This upper transition zone represents a strong supply area where selling pressure previously intensified. Any move back into this zone is likely to attract sellers and reinforce the bearish bias.
55.90 – 56.95 – Bullish Transition Zone.
This lower transition zone is acting as a near term demand area where price is currently stabilizing. A failure to hold this zone would increase the probability of further downside extension.
🔹 Dynamic Support/Resistance Levels:
Price: 60.50
Level 1 at 60.50 functions as a key dynamic resistance aligned with the upper transition zone. Rejection from this level would confirm continued seller control.
Price: 55.75
Level 2 at 55.75 serves as an important dynamic support just below current price. A decisive break below this level would expose additional downside potential.
🔹 Commentary:
Price is currently consolidating near the lower transition zone within a bearish structure. Selling pressure remains controlled but persistent, suggesting continuation rather than exhaustion. Any short term rebounds are likely to be corrective while below resistance. Traders should monitor reactions around dynamic support for confirmation of continuation or short term stabilization.
S&P 500
🔹 Overall Sentiment:
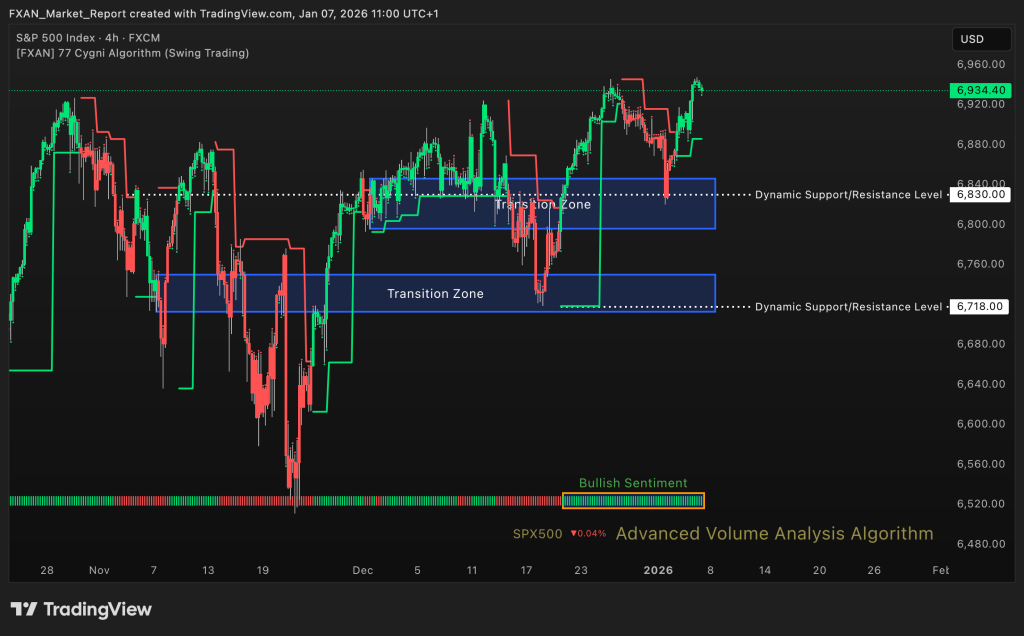
Bullish – The S&P 500 continues to display a bullish sentiment for more than two weeks, supported by strong upside momentum and consistent higher highs. Buyers remain firmly in control, with pullbacks being shallow and quickly absorbed. Price continues to trade above key structural support, reinforcing the strength of the trend. As long as this structure remains intact, the bullish bias is expected to persist.
🔹 Transition Zones:
6713 – 6750 – Bearish Transition Zone.
This lower transition zone represents a major demand area where buyers previously stepped in aggressively. A retracement into this zone would likely attract renewed buying interest and support the broader bullish structure.
6796 – 6846 – Bullish Transition Zone.
This upper transition zone has transitioned into a key support area following the recent breakout. Holding above this zone confirms bullish strength, while a failure to hold could signal the start of a deeper corrective phase.
🔹 Dynamic Support/Resistance Levels:
Price: 6830
Level 1 at 6830 functions as an important dynamic support within the current bullish structure. Sustained trading above this level keeps upside momentum intact.
Price: 6718
Level 2 at 6718 serves as a deeper dynamic support aligned with the lower transition zone. A break below this level would indicate a potential shift toward a corrective environment.
🔹 Commentary:
Price is currently consolidating near recent highs, reflecting strength rather than exhaustion. Momentum remains constructive, with buyers stepping in on minor pullbacks. Any short term retracement toward dynamic support may be viewed as a continuation opportunity within the broader trend. Traders should monitor reactions around the transition zones for confirmation of sustained bullish momentum or early signs of correctionsi.
BTC/USD (Bitcoin)
🔹 Overall Sentiment:
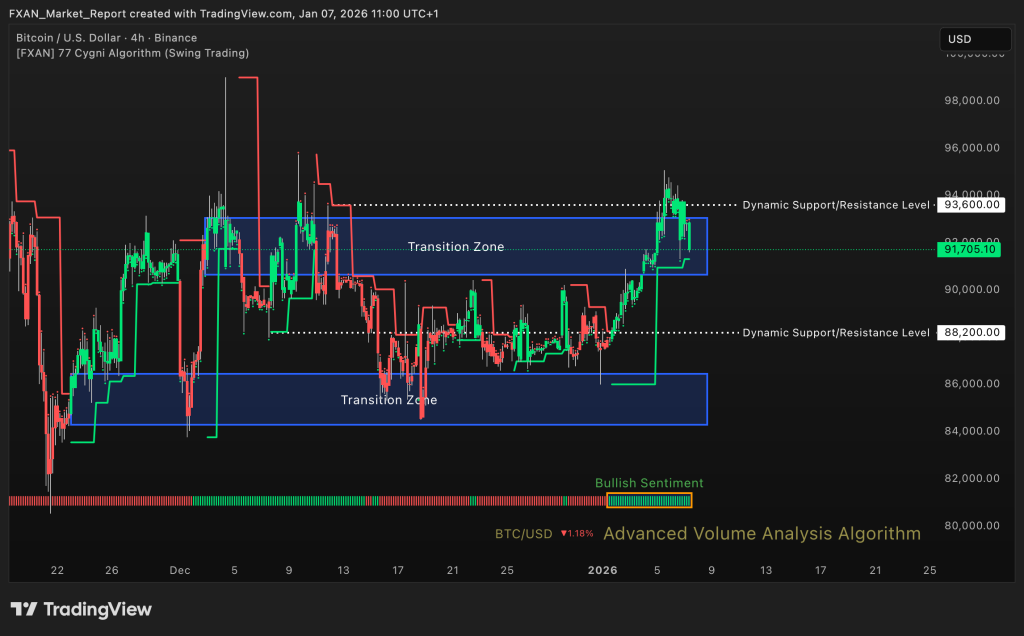
Bullish – BTC/USD has maintained a bullish sentiment for more than six days, supported by sustained upside momentum and strong buyer participation. Price has rebounded firmly from recent consolidation and continues to trade above key structural support. Higher highs and higher lows remain intact, reinforcing the bullish market structure. As long as price holds above major support, the upside bias remains valid.
🔹 Transition Zones:
84,300 – 86,450 – Bullish Transition Zone.
This lower transition zone represents a major demand area where buyers previously defended price aggressively. A retracement into this zone would likely attract strong buying interest and help preserve the broader bullish structure.
90,650 – 93,050– Bullish Transition Zone.
This upper transition zone acts as an active decision area and is currently being tested by price. Holding above this zone signals strength and supports continuation toward higher resistance, while rejection could lead to short term consolidation.
🔹 Dynamic Support/Resistance Levels:
Price: 88,200
Level 1 at 88,200 functions as a key dynamic support within the current bullish structure. Sustained trading above this level keeps bullish momentum intact.
Price: 93,600
Level 2 at 93,600 serves as an important dynamic resistance where profit taking may emerge. A clean break above this level would confirm further bullish continuation.
🔹 Commentary:
Price is currently consolidating within the upper transition zone, reflecting strong buyer control rather than weakness. Momentum remains constructive, with pullbacks being shallow and quickly absorbed. Any short term consolidation above dynamic support would be considered healthy within the trend. Traders should monitor reactions near dynamic resistance for confirmation of breakout or temporary rejection.