
EUR/USD

🔹 Overall Sentiment:
Bearish – EUR/USD has shifted to bearish sentiment over the past day, as indicated by the 77 Cygni algorithm. After showing bullish momentum earlier, the price has recently broken below a key dynamic support level on increased volume, signaling a potential reversal and caution for traders amid uncertain near-term direction.
🔹 Transition Zones:
1.12300 – 1.13500 – Bullish Transition Zone.
This lower zone has historically acted as strong support during previous pullbacks, but the current price action suggests that a test of this area could occur again.
1.14950 – 1.15350 – Bullish Transition Zone.
A previously important consolidation zone where price found temporary support, now under pressure due to recent bearish momentum, reflecting weakening buyer control.
🔹 Dynamic Support/Resistance Levels:
Price: 1.14500
A significant dynamic support level that traders will watch closely. A break below this level may confirm bearish continuation and expose lower targets.
Price: 1.16850
Formerly a resistance turned support, this level is currently tested as price shows signs of weakness, indicating possible short-term volatility and further downside risk.
🔹 Commentary:
The recent shift to bearish sentiment in EUR/USD highlights growing selling pressure and market uncertainty. Traders should be cautious and monitor key dynamic support levels, especially 1.14500, to assess whether the price will hold or continue lower. Factors such as monetary policy updates, economic data releases, and geopolitical developments remain critical in shaping near-term price direction. Overall, the market appears vulnerable to a deeper correction unless bullish catalysts reemerge.
GBP/USD
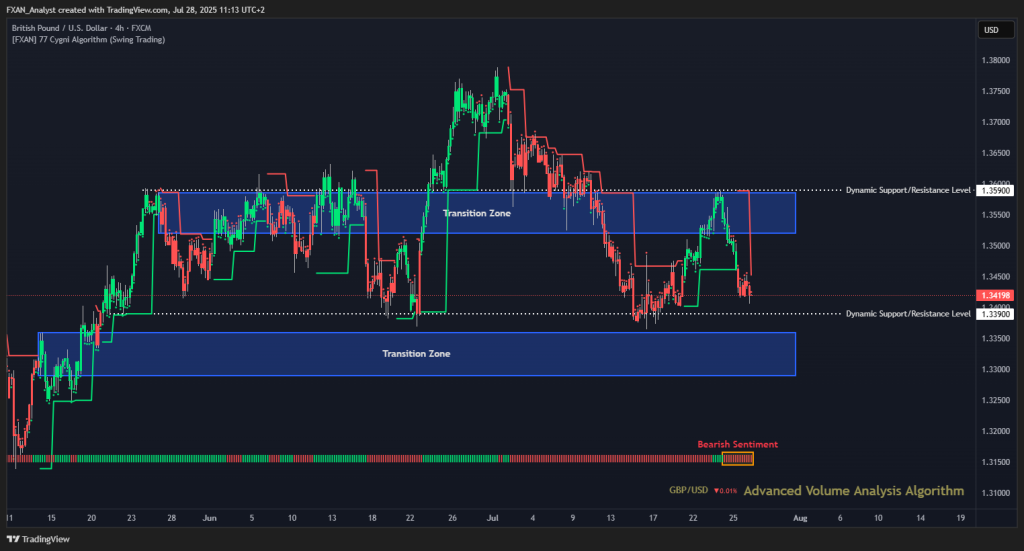
🔹 Overall Sentiment:
Bearish – GBP/USD is showing sustained bearish sentiment over the past three days according to the 77 Cygni algorithm. Price action indicates weakening buyer control with repeated failures to break above key resistance levels. This suggests cautious selling pressure and a potential continuation of the bearish trend if dynamic support levels are breached.
🔹 Transition Zones:
1.32900 – 1.33600 – Bullish Transition Zone.
This zone has acted as a critical support area where price found temporary relief during recent declines. A break below this zone may signal further downside momentum.
1.35200 – 1.35850 – Bearish Transition Zone.
A higher consolidation zone where previous price action showed hesitation and distribution, now serving as resistance as sellers regain control.
🔹 Dynamic Support/Resistance Levels:
Price: 1.33900
A key dynamic support level currently under pressure. Failure to hold this level could accelerate bearish momentum and trigger additional selling.
Price: 1.35900
This level serves as dynamic resistance, preventing price advances. Continued rejection here confirms bearish strength in the near term.
🔹 Commentary:
The bearish sentiment in GBP/USD highlights increasing selling interest amid uncertainty. Traders should watch the 1.33900 support level closely, as its breach may pave the way for deeper declines. Key market drivers include economic data releases, central bank policy decisions, and geopolitical factors. Until bullish catalysts reemerge, downside risk remains elevated. Maintaining discipline around these transition and support zones will be crucial for managing risk.
GOLD (XAU/USD)

🔹 Overall Sentiment:
Bearish – XAU/USD is currently showing bearish sentiment over the past two days as indicated by the 77 Cygni algorithm. After a period of bullish momentum, the price is facing resistance near key levels and has pulled back with weakening buyer conviction. This suggests cautious selling pressure with the potential for further downside movement if critical support zones fail to hold.
🔹 Transition Zones:
3208 – 3262 – Bullish Transition Zone.
This lower zone has acted as a significant support area where buyers previously stepped in. Holding this zone is crucial to avoid further losses.
3355 – 3415 – Bearish Transition Zone.
The upper zone, which recently contained price advances, now acts as resistance, limiting upside potential amid bearish pressure.
🔹 Dynamic Support/Resistance Levels:
Price: 3271
A key dynamic support level that is currently being tested. A break below this level may accelerate bearish momentum.
Price: 3387
This level serves as dynamic resistance and has capped recent rallies, reinforcing the bearish outlook.
🔹 Commentary:
The recent shift to bearish sentiment in XAU/USD signals increasing caution among traders after a strong rally. The key focus remains on the transition zones and support levels, which will determine whether the price consolidates or resumes its downtrend. Market participants should watch for economic data releases, Federal Reserve policy updates, and geopolitical tensions, which continue to heavily influence gold’s safe-haven appeal. Until a clear catalyst emerges, downside risks remain elevated.
WTI (Crude Oil)

🔹 Overall Sentiment:
Bearish – WTI Crude Oil is exhibiting bearish sentiment over the past week, as indicated by the 77 Cygni algorithm. The price has struggled to sustain upward momentum, with sellers exerting pressure near key resistance areas. This reflects cautious trading amid uncertainty about supply-demand dynamics and geopolitical influences, suggesting a potential continuation of downside risk if critical support levels fail.
🔹 Transition Zones:
61.30 – 63.30 – Bearish Transition Zone.
This zone has served as important support during recent pullbacks, where buying interest emerged to prevent deeper declines. Holding this zone is essential for any potential reversal.
🔹 Dynamic Support/Resistance Levels:
Price: 60.20
A crucial dynamic support level that has contained selling pressure in previous dips, acting as a floor for price action.
Price: 64.50
This level represents dynamic resistance and has capped rallies, reinforcing the bearish outlook until broken decisively.
🔹 Commentary:
The bearish sentiment in WTI reflects growing caution among market participants, driven by concerns over global economic growth and supply uncertainties. Key focus remains on the transition zone and support levels, which will be critical in defining short-term price direction. Traders should monitor inventory reports, OPEC production decisions, and geopolitical developments closely. Until a clear catalyst emerges to alter market dynamics, the downside bias remains dominant for WTI crude oil.
S&P 500
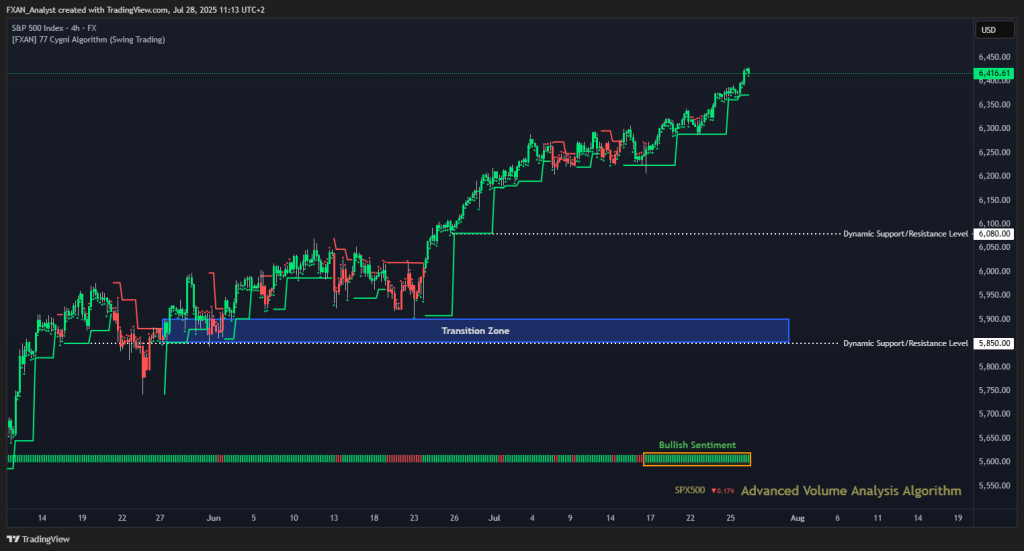
🔹 Overall Sentiment:
Bullish – S&P 500 is showing sustained bullish sentiment over the past two weeks, as indicated by the 77 Cygni algorithm. The index continues to push higher with strong volume support, breaking through previous resistance levels and signaling growing optimism among investors. This momentum reflects confidence in economic data and corporate earnings, suggesting further upside potential in the near term.
🔹 Transition Zones:
5852 – 5900 – Bullish Transition Zone.
This zone acted as a significant support area during recent consolidation phases, where buyers stepped in decisively to prevent deeper pullbacks and set the stage for the current rally.
🔹 Dynamic Support/Resistance Levels:
Price: 5850
A critical dynamic support level that has successfully contained selling pressure, providing a solid base for the ongoing upward trend.
Price: 6080
Former resistance now acting as support, reinforcing the strength of the bullish momentum and offering a buffer against short-term retracements.
🔹 Commentary:
The bullish sentiment in the S&P 500 highlights robust investor confidence, supported by favorable economic indicators and strong earnings reports. The defense of key transition zones underscores the resilience of the current uptrend. Traders should monitor the dynamic support levels closely, as holding above these will be crucial for maintaining momentum. Watch for upcoming macroeconomic releases and geopolitical events that could influence market direction. Overall, the outlook remains positive for the S&P 500 in the near term.
BTC/USD (Bitcoin)

🔹 Overall Sentiment:
Bullish – BTC/USD is exhibiting renewed bullish sentiment over the past four days, as indicated by the 77 Cygni algorithm. The price has managed to stabilize and move higher after a recent consolidation, breaking key resistance levels with moderate volume. This suggests renewed buying interest and potential continuation of the uptrend in the near term.
🔹 Transition Zones:
103,950 – 105,500 – Bullish Transition Zone.
This zone provided crucial support during the previous consolidation phase, where buyers accumulated positions and prepared for the recent upward move.
107,750 – 109,200 – Bearish Transition Zone.
This higher zone acted as a consolidation area before the latest breakout, reflecting strong demand and positive market sentiment.
🔹 Dynamic Support/Resistance Levels:
Price: 104,000
A key dynamic support level that held during recent pullbacks, helping to maintain the bullish momentum.
Price: 106,700
Previously a resistance, now acting as support, reinforcing the strength of the upward trend and cushioning against short-term corrections.
🔹 Commentary:
The bullish sentiment in BTC/USD reflects cautious optimism among market participants, supported by successful defense of critical transition zones. The breakout above these levels signals potential for further gains, although traders should watch the dynamic support levels closely to confirm ongoing strength. Key drivers include institutional interest, regulatory clarity, and broader macroeconomic factors affecting risk assets. Overall, the outlook remains positive for Bitcoin over the short term.