
EUR/USD
🔹 Overall Sentiment:
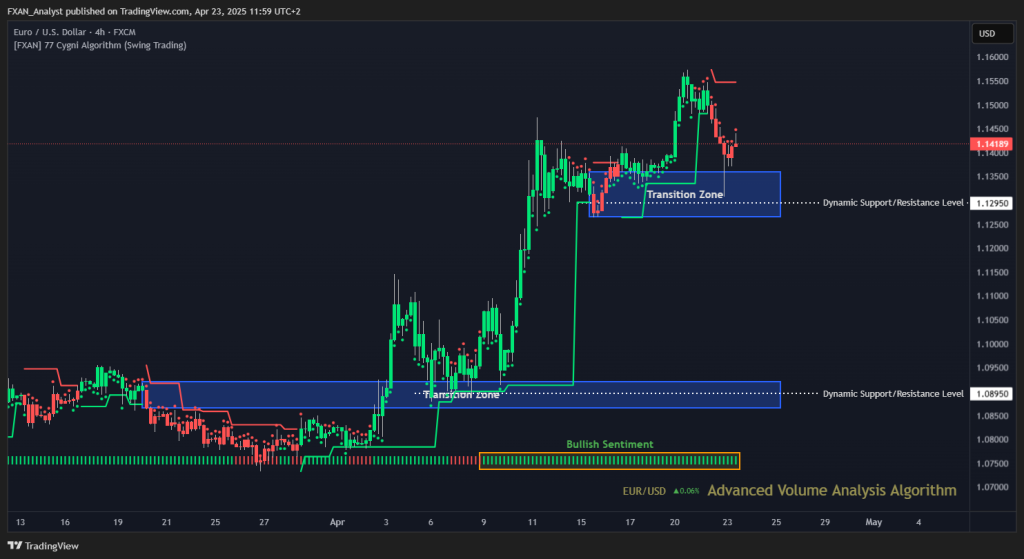
Bullish – EUR/USD is trading at 1.14189, maintaining its bullish structure developed over the last two weeks. The pair experienced a strong rally from early April and recently saw a corrective dip, which may serve as a healthy consolidation rather than a sign of reversal. Momentum has cooled off slightly after the push above 1.15000, yet bullish sentiment remains intact on the volume algorithm. Price is still well above structural support, suggesting that this pullback could evolve into a base for further continuation.
🔹 Transition Zones:
1.08650 – 1.09200 – Bearish Transition Zone.
This was a crucial accumulation range where price consolidated before initiating the rally. It now acts as a long-term demand zone, supporting the entire bullish structure.
1.12650 – 1.13600 – Bearish Transition Zone.
After a brief consolidation within this zone, price exploded upward. It is now retesting this zone from above, and its ability to hold here will determine whether the uptrend continues in the short term.
🔹 Dynamic Support/Resistance Levels:
Price: 1.08950
A strong support level marking the base of the broader bullish move. If the market were to see a deeper correction, this level would become a significant line of defense for buyers.
Price: 1.12950
Currently acting as near-term dynamic support. The pair is retesting this region after the recent breakout, and how price reacts here will be critical for short-term sentiment.
🔹 Commentary:
The EUR/USD pair has entered a correction phase after a sharp move higher, which could serve to shake out weaker hands and refuel momentum. The market structure remains decisively bullish as long as it holds above 1.12950. A bullish reaction within the 1.12950–1.13600 zone would reinforce the uptrend and offer potential long setups toward 1.15000+ targets. However, failure to defend this zone could expose the pair to a deeper retest toward 1.11000–1.11500.
GBP/USD
🔹 Overall Sentiment:
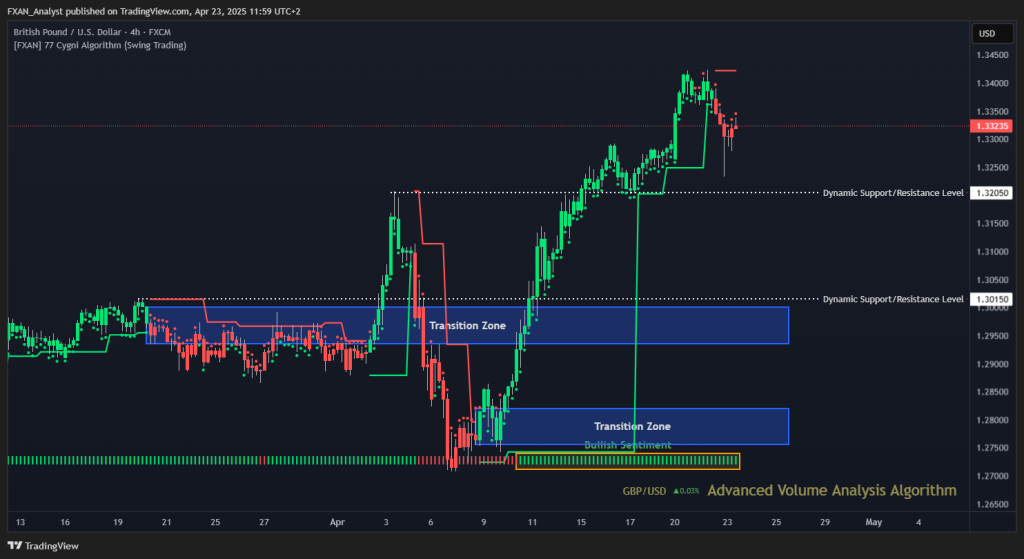
Bullish – GBP/USD is currently trading at 1.33235, sustaining a bullish stance that has been in place for the past two weeks. The price action has printed a consistent sequence of higher highs and higher lows, reinforcing the strength of the uptrend and showcasing persistent buying interest. Even after reaching new highs above the 1.34000 handle, the pair is experiencing only a mild correction, signaling that bulls are still in control. The sentiment indicator confirms strong bullish volume inflows, suggesting dips could continue to be bought.
🔹 Transition Zones:
1.27550 – 1.28200 – Bullish Transition Zone.
This lower zone marked the origin of the impulsive bullish rally and now stands as a major accumulation area. The clean break and rejection from this zone affirm its role as a critical demand zone for future pullbacks.
1.29350 – 1.30000 – Bearish Transition Zone.
Previously a choppy consolidation area, this range was taken out with strong momentum. The market respected it on the way up, indicating it could act as the first layer of defense if price attempts a deeper correction.
🔹 Dynamic Support/Resistance Levels:
Price: 1.30150
This level served as the breakout point that fueled the surge toward new highs. It’s now a major support level that traders will closely monitor for potential long entries in case of a retracement.
Price: 1.32050
Price has pulled back from just above this resistance. Whether bulls reclaim this level in the coming sessions will offer clues about whether the uptrend continues immediately or pauses for consolidation.
🔹 Commentary:
GBP/USD is still favoring the upside, but signs of consolidation or a corrective pullback have started to surface after an extended bullish run. The pair is testing support just below the 1.33500 area, and a bounce from here could reignite bullish momentum toward 1.34500 and beyond. However, a loss of 1.32050 could signal a broader retracement toward the 1.30500–1.31000 region, where bullish interest may reemerge with more conviction.
GOLD (XAU/USD)
🔹 Overall Sentiment:
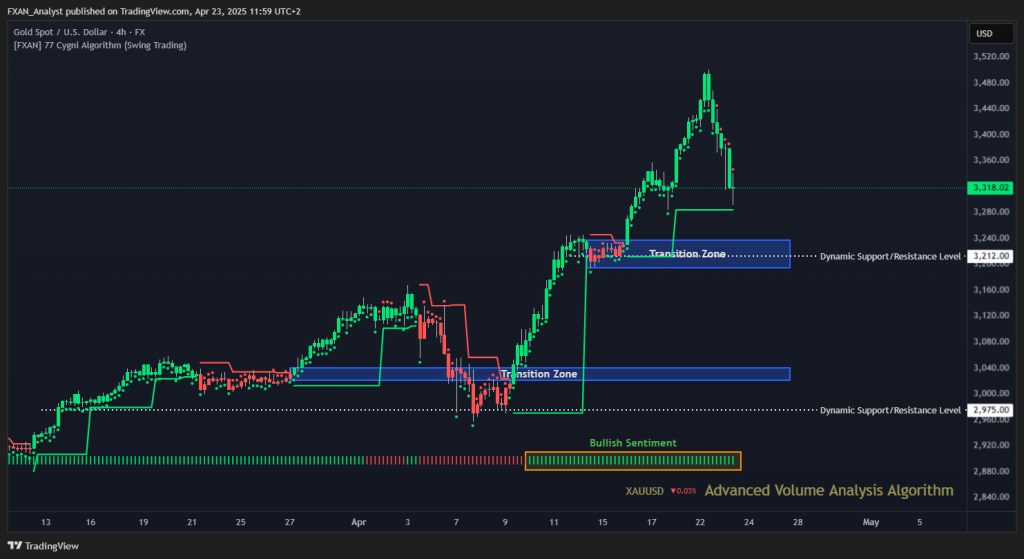
Bullish – Gold is currently trading at 3318, sustaining a strong bullish sentiment that has been present for over a week and a half. The recent impulsive breakout above the 3200 level confirmed bullish dominance, supported by consistent volume inflows and a steep upward trajectory. While we are now seeing a corrective pullback, the broader structure remains intact. Price is still well above key support areas, and any dip into demand zones is likely to attract renewed buying interest.
🔹 Transition Zones:
3020 – 3040 – Bullish Transition Zone.
This zone marked the early-stage accumulation before the explosive rally began. It has now evolved into a foundational support layer and could offer major buying opportunities if price retraces deeply.
3194 – 3237 – Bearish Transition Zone.
This upper zone was recently broken, then retested as price surged higher toward the 3400 region. It’s now acting as a short-term reaction zone where bulls may defend to maintain momentum.
🔹 Dynamic Support/Resistance Levels:
Price: 2975
A key level that acted as the base of the broader bullish structure. If gold were to drop back toward this level, it would suggest a more significant retracement is underway—but for now, it remains distant from price action.
Price: 3212
This level is more immediate and highly relevant. It aligns with the upper transition zone and is currently being tested as support. A successful defense here would confirm bullish continuation, while a loss may open the door for deeper retracements.
🔹 Commentary:
XAU/USD remains in a bullish phase despite the recent correction from new highs around 3480. The current retracement is healthy and provides room for consolidation or potential reaccumulation above the 3212 support zone. If bulls can maintain control above this region, the uptrend is likely to resume, with the next psychological targets near 3400 and 3500. However, a break below 3190–3210 could lead to further downside toward 3100 before bulls step in again.
WTI (Crude Oil)
🔹 Overall Sentiment:
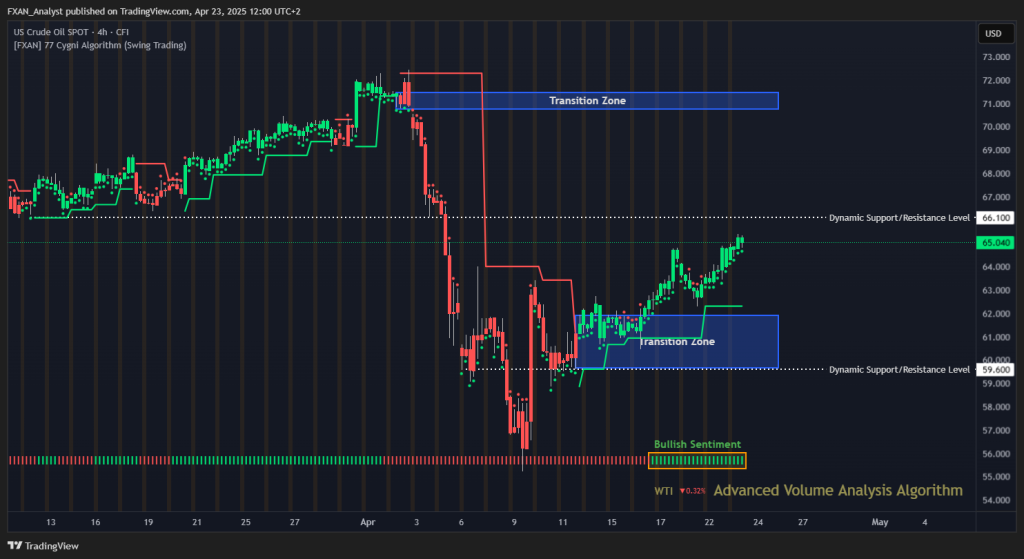
Bullish – WTI crude oil is currently trading at 65.040, continuing to build on the strong upward momentum seen throughout the past week. After a prolonged downtrend earlier in the month, sentiment has shifted decisively in favor of the bulls, with price steadily recovering and climbing above several key levels. The current price action suggests a solid base has been established, and the clean structure of higher lows reflects a healthy uptrend. As we approach a major resistance level, traders will be watching closely for signs of continuation or exhaustion.
🔹 Transition Zones:
59.650 – 61.900 – Bullish Transition Zone.
This zone served as a springboard for the recent rally. Price spent several sessions consolidating in this area before finally breaking out with strong momentum. It’s now a confirmed demand zone and is likely to hold if price revisits it in a corrective phase.
70.750 – 71.450 – Bearish Transition Zone.
Still untouched in the current cycle, this upper zone represents a significant resistance zone where bears are expected to react. If bulls remain in control, this would be a likely upside target.
🔹 Dynamic Support/Resistance Levels:
Price: 59.600
This key level has already proven its strength, acting as the baseline for the current trend reversal. As long as price remains above this level, the bullish structure is intact, and it can be considered the anchor point for ongoing momentum.
Price: 66.100
WTI is now nearing this resistance level, which could be a pivotal test for the bulls. A breakout above this zone would open the door toward the 70.00 handle and beyond, while a failure could lead to a short-term pullback.
🔹 Commentary:
WTI crude oil has shifted from deep bearish sentiment into a constructive bullish recovery, supported by strong volume and clean price action. The breakout from the lower transition zone confirmed the shift in market structure, and traders now await a test of the 66.100 dynamic resistance. If the level is cleared with conviction, the market may aim for a full retrace into the 70.750 – 71.450 transition zone. However, any stall or rejection here may result in a mild dip back toward 62.00–63.00 before another leg higher.
S&P 500
🔹 Overall Sentiment:
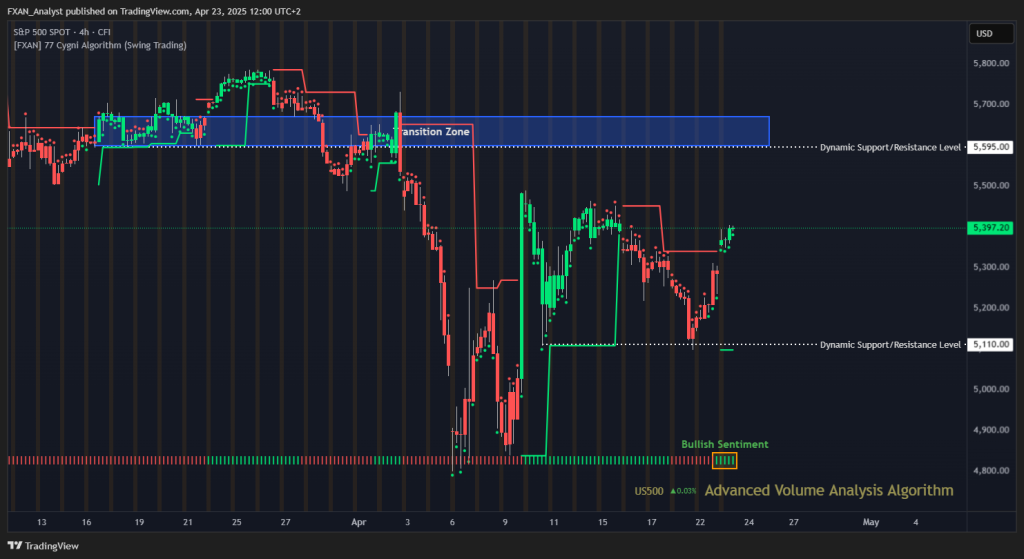
Bearish – The S&P 500 is trading at 5,397, rebounding with renewed strength after dipping into lower support levels earlier this week. The recent price action shows a swift and clean recovery off the 5,110 support zone, supported by a shift in momentum and an increase in bullish sentiment. Although the bullish trend is only one day strong, the structure is promising with a fresh higher low formation. If buyers maintain control, we could see a continuation toward key resistance levels in the coming sessions.
🔹 Transition Zones:
5598 – 5669 – Bullish Transition Zone.
This transition zone marks a major overhead resistance cluster. Price failed to maintain bullish momentum the last time it tested this area, leading to a sharp rejection. It remains the primary target zone for bulls and a probable battleground for control in the short term.
🔹 Dynamic Support/Resistance Levels:
Price: 5110
This level continues to prove its importance as a strong base. It acted as the bottom during the recent correction and sparked the current bullish impulse. A hold above this level confirms the strength of the rebound.
Price: 5595
The next significant resistance to the upside. Price previously struggled to break above it, making this zone highly reactive. A breakout here could fuel a larger rally, while a rejection may set the stage for another dip.
🔹 Commentary:
The S&P 500 has bounced back impressively from recent lows, supported by a clear shift in sentiment and structure. If momentum sustains into the new week, we could see a challenge of the 5595 resistance and an attempt to re-enter the broader transition zone between 5598 and 5669. However, bulls must remain cautious of weakening volume or divergence signals, which could hint at a pause or potential reversal. For now, dips are likely to be seen as buying opportunities as long as 5110 holds firm.
BTC/USD (Bitcoin)
🔹 Overall Sentiment:
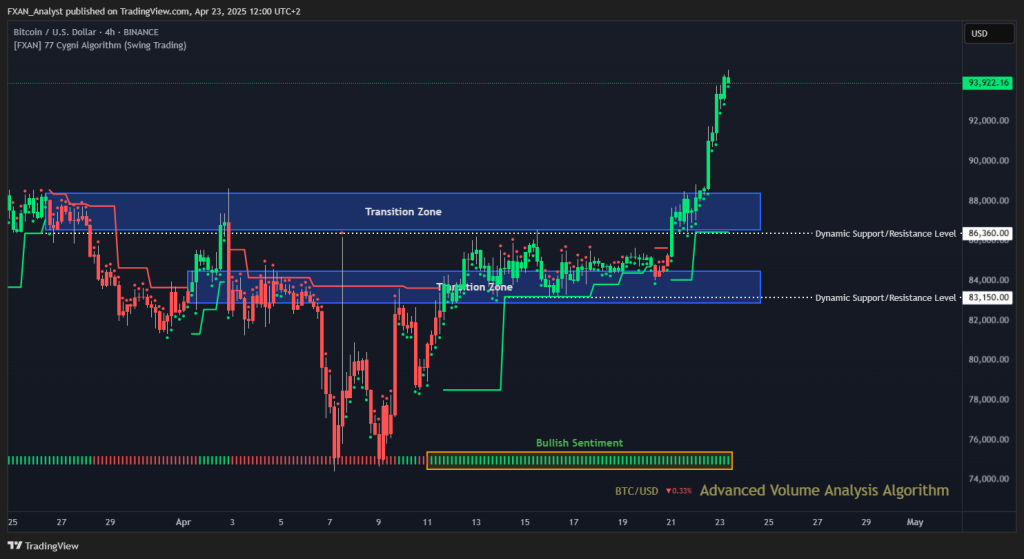
Bullish – Bitcoin is currently trading at $93,922, marking a remarkable continuation of the bullish trend that has been active for the past two weeks. This explosive move signals significant buyer conviction, with BTC surging through multiple resistance levels without major hesitation. Momentum remains firmly to the upside, and the aggressive volume and sentiment support the idea that bulls are in full control. With BTC entering levels not seen in weeks, traders may look for consolidation or mild pullbacks before any further upside continuation.
🔹 Transition Zones:
82,850 – 84,450 – Bullish Transition Zone.
This lower transition zone was a prolonged range that recently served as a major accumulation zone. Its clean breakout launched the bullish rally and now acts as a key support area on any retracement.
86,530 – 88,375 – Bearish Transition Zone.
Previously a resistance pocket, this transition zone was taken out swiftly, with little reaction from sellers. Its breach signals strong demand, and it could now serve as an important demand zone if price returns to retest it.
🔹 Dynamic Support/Resistance Levels:
Price: 83150
This level previously acted as a cap on bullish momentum, but that ceiling has been shattered. It now underpins the structure and represents the bottom edge of recent bullish consolidation.
Price: 86360
Now left far behind, this level’s breach is a clear sign of strength. It aligns closely with the upper boundary of the second transition zone, confirming it as a valid technical reference that might offer support if tested again.
🔹 Commentary:
BTC/USD is in full breakout mode, surpassing $93K and climbing aggressively toward psychological round numbers. Volume confirms the rally’s legitimacy, and the sentiment has remained consistently bullish throughout the move. While conditions are strong, traders should remain cautious of possible short-term exhaustion. Ideally, a minor pullback into the 88K–86K region would offer a healthy reset and a potential continuation setup. Above 94K, BTC may begin targeting the six-figure mark over the longer term if bullish momentum persists.