
EUR/USD
🔹 Overall Sentiment:
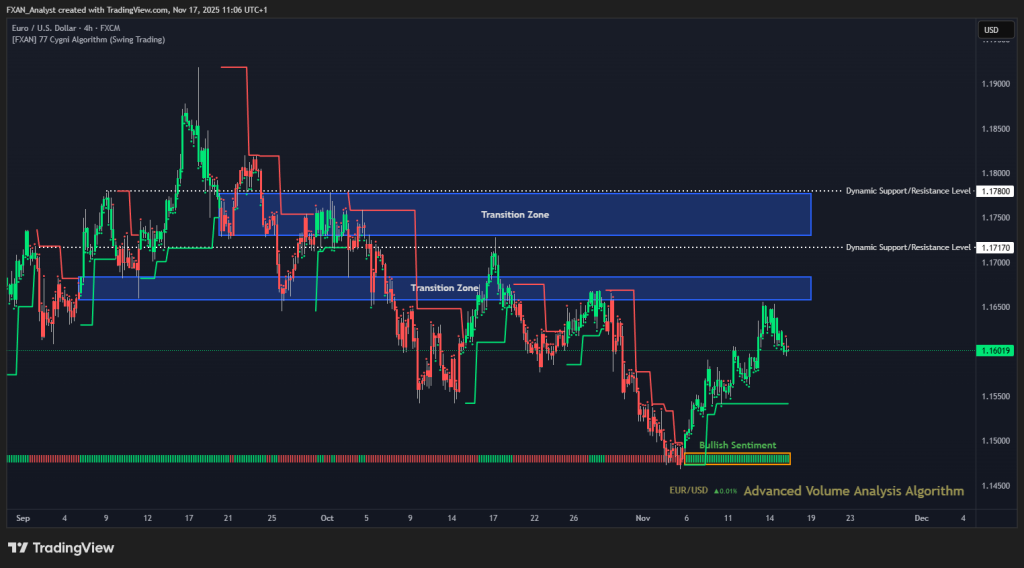
Bullish – EUR/USD has maintained a bullish sentiment for the past week and a half, with buyers steadily pushing price upward from the recent lows. Momentum remains constructive, although the pair is currently experiencing a mild pullback after reaching short-term highs. The broader trend structure still favors the upside as long as buyers defend higher lows. However, the next bullish continuation will depend on how price reacts to the upcoming resistance zones.
🔹 Transition Zones:
1.16580 – 1.16840 – Bullish Transition Zone.
The first transition zone between 1.16580 and 1.16840 represents an important area where price has previously struggled to break through. A strong bullish reaction here would signal renewed momentum and potentially set the stage for a retest of higher levels.
1.17300 – 1.17770 – Bearish Transition Zone.
The second transition zone between 1.17300 and 1.17770 is a thicker, more significant resistance band that could cap bullish advances. A clean breakout above this range would confirm broader trend strength and open the door toward the next dynamic level.
🔹 Dynamic Support/Resistance Levels:
Price: 1.17170
The dynamic resistance at 1.17170 is the first key barrier buyers must overcome to reestablish upward momentum. A sustained move above this level would indicate that bulls are gaining control.
Price: 1.17800
The higher dynamic resistance at 1.17800 marks a major threshold and aligns with the upper transition zone. Breaking above it would signal a strong directional shift, likely accelerating bullish sentiment.
🔹 Commentary:
EUR/USD continues to show resilience, with buyers confidently maintaining upward pressure despite short-term fluctuations. Current market structure suggests that dips may continue to attract demand as long as macro conditions remain stable. Traders should monitor reactions around the first transition zone for early clues of renewed bullish activity. A failure to reclaim resistance levels, however, could introduce a deeper correction before the next potential upward leg.
GBP/USD
🔹 Overall Sentiment:
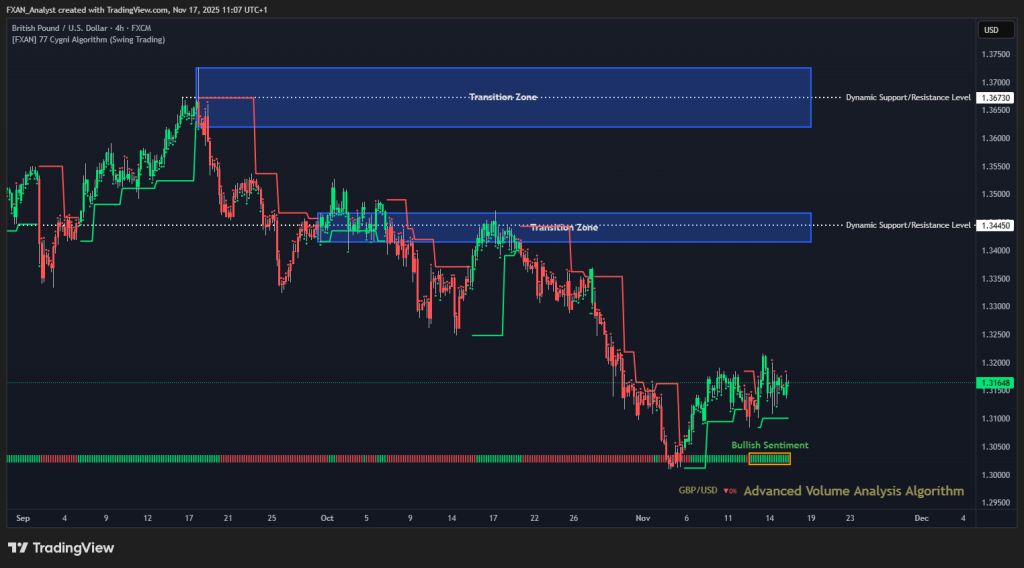
Bullish – GBP/USD has maintained a bullish sentiment for the past five days as buyers continue to defend higher lows and gradually push the pair higher. Momentum has stabilized after the strong impulsive recovery from the early-November lows. Although price is still trading below key structural resistance zones, the short-term direction favors continued attempts to break higher. Bulls, however, will need stronger follow-through to challenge the broader downtrend structure that still dominates higher timeframes.
🔹 Transition Zones:
1.36200 – 1.37250 – Bearish Transition Zone.
The first transition zone between 1.36200 and 1.37250 represents a major resistance region that has repeatedly rejected bullish advances in the past. This is the upper boundary where any sustained bullish trend would need to gain traction for a larger reversal.
1.34150 – 1.34660 – Bullish Transition Zone.
The second transition zone between 1.34150 and 1.34660 sits closer to current price and forms the first major resistance cluster. A clear breakout above this area would confirm stronger bullish continuation and put the higher zone into play.
🔹 Dynamic Support/Resistance Levels:
Price: 1.34450
The dynamic level at 1.34450 aligns closely with the lower transition zone and serves as a primary upside objective. A successful break and hold above this level would signal increased buying strength and a potential shift in market sentiment.
Price: 1.36730
The higher dynamic level at 1.36730 marks a significant barrier and aligns with the upper transition zone. A move through this level would represent a meaningful structural break and open the door for a broader bullish recovery.
🔹 Commentary:
GBP/USD continues to show resilience as buyers remain active, though progress has been somewhat gradual and cautious. Market participants may be waiting for fresh catalysts before committing to larger directional moves. The pair remains vulnerable to pullbacks if bullish momentum stalls beneath the lower transition zone. Traders should watch for how price behaves near dynamic resistance, as a rejection could signal a return to range-bound trading, while a strong break would indicate renewed bullish conviction.
GOLD (XAU/USD)
🔹 Overall Sentiment:
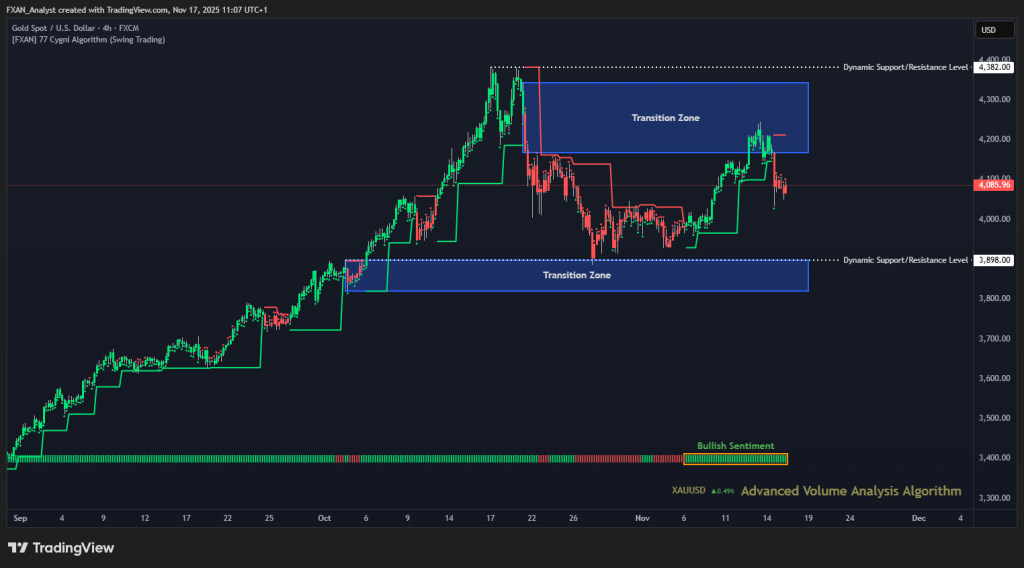
Bullish – XAU/USD has maintained a bullish sentiment for the past week and a half, with buyers consistently stepping in to support upward momentum. Although price has recently pulled back from the local highs, the overall structure remains constructive above key support levels. The recent rejection near the upper transition zone signals short-term hesitation, but the broader trend still favors the bulls. Continued stability above dynamic support would strengthen the case for renewed bullish attempts.
🔹 Transition Zones:
3820 – 3898 – Bearish Transition Zone.
The first transition zone between 3820 and 3898 represents a major accumulation area where buyers have repeatedly defended price, creating a strong foundation for the recent upward move. A return to this zone would likely attract renewed bullish interest and serve as a critical support region.
4167 – 4342 – Bearish Transition Zone.
The second transition zone between 4167 and 4342 marks a major resistance cluster where previous rallies have struggled to break through. A decisive close above this area would signal strong continuation and open the path toward higher targets.
🔹 Dynamic Support/Resistance Levels:
Price: 3898
The dynamic level at 3898 aligns with the lower transition zone and acts as a key structural support. Holding above this level keeps bullish momentum intact and reduces the probability of a deeper correction.
Price: 4382
The upper dynamic level at 4382 represents the major resistance ceiling that bulls ultimately need to overcome. A breakout above this level would confirm a strong shift in market sentiment and potentially trigger an extended bullish leg.
🔹 Commentary:
Gold continues to show strong resilience despite recent pullbacks, with the underlying trend structure favoring buyers. The current congestion beneath the upper transition zone suggests that the market is consolidating before its next directional move. Traders should monitor whether price can regain bullish momentum and attempt another push into the 4167–4342 zone. A failure to hold above local support, however, may introduce short-term volatility, but the broader bullish bias remains intact as long as price stays above the 3898 dynamic support level.
WTI (Crude Oil)
🔹 Overall Sentiment:
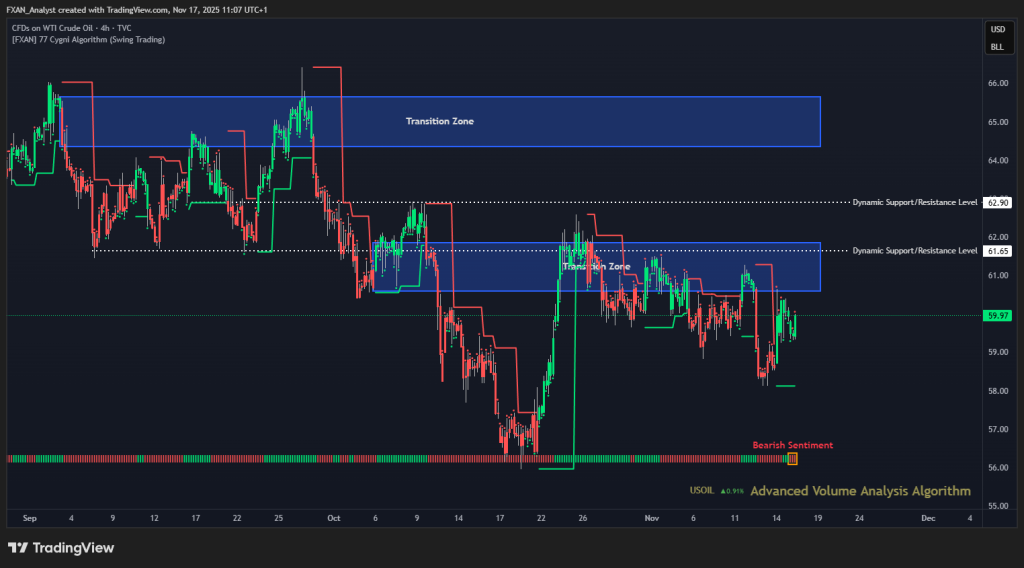
Bearish – WTI is showing bearish sentiment over the past day, with sellers maintaining pressure as price struggles to gain upward traction. The market continues to trade below key resistance levels, reflecting a lack of bullish conviction. Recent volatility highlights uncertainty, but overall momentum favors the downside for now. Unless buyers regain control above the nearby resistance areas, downward pressure is likely to persist.
🔹 Transition Zones:
64.35 – 65.65 – Bearish Transition Zone.
The first transition zone between 64.35 and 65.65 represents a major overhead barrier where previous rallies have repeatedly failed. A move into this zone would likely encounter strong selling interest unless market sentiment shifts significantly.
60.60 – 61.85 – Bullish Transition Zone.
The second transition zone between 60.60 and 61.85 currently acts as a closer resistance region. Price repeatedly rejected within this range, indicating that buyers are struggling to build momentum above it.
🔹 Dynamic Support/Resistance Levels:
Price: 61.65
The dynamic level at 61.65 sits within the second transition zone and reinforces this area as a significant resistance layer. Price would need a clean break above this level to signal potential bullish recovery.
Price: 62.90
The upper dynamic resistance at 62.90 marks an important turning point for sentiment. A sustained move above this threshold would weaken the bearish outlook and open the path toward higher levels.
🔹 Commentary:
WTI remains under pressure as it trades below multiple resistance zones, reflecting a market still dominated by sellers. Short-term rebounds may occur, but without a break above the 60.60–61.85 transition zone, upside attempts are likely to be limited. Traders should watch for signs of stronger buying volume before expecting any meaningful reversal. Until then, bearish momentum retains the advantage, especially while price remains beneath dynamic resistance.
S&P 500
🔹 Overall Sentiment:
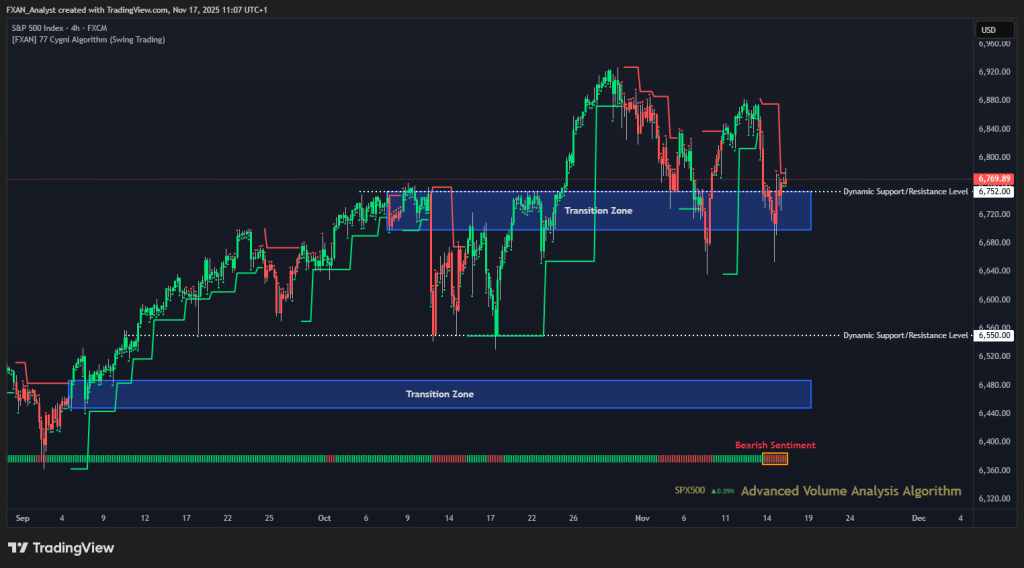
Bearish – The S&P 500 has maintained bearish sentiment for the past five days, reflecting ongoing downside pressure and weakening momentum. Price action continues to struggle near resistance levels, suggesting that buyers lack the conviction needed for a sustained recovery. The recent lower highs indicate that sellers remain in control. Until price breaks above the upper resistance region, the bearish bias remains intact.
🔹 Transition Zones:
6448 – 6487 – Bullish Transition Zone.
The first transition zone between 6448 and 6487 acts as a key support-turned-resistance area, where previous rebounds have repeatedly stalled. A return to this zone could invite seller activity once again, reinforcing downside potential.
6698 – 6752 – Bearish Transition Zone.
The second transition zone between 6698 and 6752 is currently being tested, serving as a critical short-term barrier. Sellers have defended this region effectively, keeping the index capped below the upper boundary.
🔹 Dynamic Support/Resistance Levels:
Price: 6550
The dynamic level at 6550 serves as an important structural support, and a break below it could accelerate bearish momentum. If price revisits this level, market reaction will determine whether deeper declines follow.
Price: 6752
The upper dynamic resistance at 6752 aligns with the second transition zone and is a crucial point of rejection. A sustained move above this level would be the first sign of potential bullish recovery.
🔹 Commentary:
The index continues to trade within a pressured environment, with sellers maintaining dominance near key resistance areas. Short-term rallies appear corrective rather than trend-changing, as price repeatedly fails to break above 6752. Market participants should watch for increased volatility as price moves within the transition zone. Until the S&P 500 reclaims resistance levels convincingly, downside risks remain elevated.
BTC/USD (Bitcoin)
🔹 Overall Sentiment:
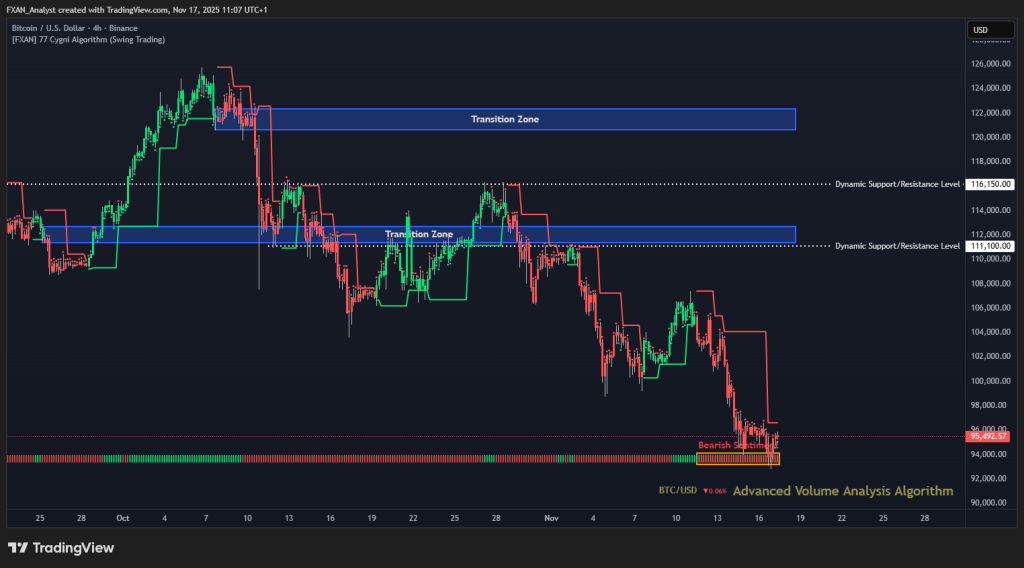
Bearish – BTC/USD has maintained strong bearish sentiment for the past week, with consistent downward pressure and no meaningful recovery attempts. Sellers remain firmly in control, as the price continues to print lower highs and lower lows. Momentum remains weak, and buyers have shown little conviction at current levels. The market outlook stays bearish unless price reclaims key resistance levels.
🔹 Transition Zones:
111,350 – 112,700 – Bearish Transition Zone.
The first transition zone at 111350 – 112700 represents a major supply region where sellers previously overwhelmed buyers. If BTC attempts a retracement, this zone is likely to act as a significant barrier, limiting any upside potential.
120,650 – 122,350 – Bearish Transition Zone.
The second transition zone at 120650 – 122350 stands as a higher-timeframe resistance band that has repeatedly rejected bullish attempts. Price would need strong momentum to break above it, which currently appears unlikely under prevailing bearish sentiment.
🔹 Dynamic Support/Resistance Levels:
Price: 116,150
The dynamic level at 116150 continues to function as a strong resistance ceiling, reflecting a structural level that has capped upward movements. A break above this point would mark the first sign of a potential trend shift.
Price: 111,100
The lower dynamic resistance at 111100 aligns closely with the first transition zone, reinforcing the area as a major obstacle for bulls. Until the price reclaims this level, bearish continuation remains the dominant expectation.
🔹 Commentary:
BTC is trading near weekly lows, showing persistent weakness as bearish sentiment extends across multiple sessions. Seller dominance is evident in repeated rejections and failure to sustain intraday recoveries. Market participants should monitor volume closely, as any increase without upward follow-through could signal further downside. For now, the path of least resistance remains to the downside, with volatility likely to rise if price breaks below current support areas.