
EUR/USD

🔹 Overall Sentiment:
Bullish – EUR/USD has maintained a bullish sentiment over the last three days, supported by strong upside momentum and higher lows on the intraday structure. Price is currently trading above a key dynamic level, indicating continued buyer dominance. The recent impulsive move suggests demand remains strong despite short term pauses. Overall market structure favors continuation as long as price holds above key support.
🔹 Transition Zones:
1.16450–1.1667 – Bearish Transition Zone.
This transition zone previously acted as a major resistance area before price broke higher. The clean breakout confirms a shift in market control toward buyers. Any pullback into this zone may attract renewed buying interest.
1.14790 – 1.15080 – Bullish Transition Zone.
The lower transition zone represents a strong accumulation base from which the current bullish leg originated. Buyers defended this area aggressively, leading to a sustained reversal. As long as price remains well above this zone, downside risk stays limited.
🔹 Dynamic Support/Resistance Levels:
Price: 1.17160
The 1.17160 level is now acting as near term dynamic support following the recent breakout. Holding above this level confirms bullish continuation and structure stability. A sustained move below would signal a potential short term correction.
Price: 1.15420
The 1.15420 level remains a key structural support within the broader bullish trend. It marks the midpoint of the previous range and strong buyer reaction area. A break below this level would weaken the bullish bias.
🔹 Commentary:
EUR/USD is showing strong bullish follow through after reclaiming prior resistance. Momentum remains constructive with buyers firmly in control of pullbacks. Volatility expansion favors continuation rather than reversal at this stage. Overall, price action supports a bullish outlook while holding above 1.17160.
GBP/USD

🔹 Overall Sentiment:
Bullish – GBP/USD has maintained a bullish sentiment for more than two weeks, supported by consistent higher highs and higher lows. Price action continues to respect key support structures, highlighting sustained buyer control. The recent consolidation near highs suggests strength rather than exhaustion. Overall market structure remains firmly bullish while price holds above dynamic support.
🔹 Transition Zones:
1.33330–1.33660 – Bullish Transition Zone.
This transition zone has acted as a key resistance turned support area after the recent breakout. Price acceptance above this zone confirms bullish continuation. Pullbacks into this range are likely to be viewed as buying opportunities.
1.30390–1.30650 – Bullish Transition Zone.
The lower transition zone represents a major demand base that initiated the broader bullish move. Strong accumulation from this area led to the sustained upside trend. As long as price remains well above this zone, the bullish bias stays intact.
🔹 Dynamic Support/Resistance Levels:
Price: 1.32480
The 1.32480 level is acting as an important dynamic support, aligning with previous structure lows. Buyers have repeatedly defended this area, reinforcing trend strength. A clean break below would signal a deeper corrective phase.
Price: 1.30820
The 1.30820 level remains a critical structural support within the medium term trend. It marks a prior consolidation zone with strong buyer reaction. A loss of this level would significantly weaken the bullish outlook.
🔹 Commentary:
GBP/USD continues to trade with strong bullish momentum despite short term consolidation near highs. Market structure favors continuation rather than reversal at this stage. Buyers remain in control as long as price holds above key dynamic support levels. Overall price behavior supports a sustained bullish scenario.
GOLD (XAU/USD)

🔹 Overall Sentiment:
Bullish –XAU/USD has maintained a bullish sentiment for the last five days, driven by strong upward momentum and sustained buying pressure. Price continues to print higher highs and higher lows, confirming trend continuation rather than exhaustion. Bullish structure remains intact as price holds comfortably above key dynamic support levels. Overall market behavior signals confidence from buyers at current levels.
🔹 Transition Zones:
3820–3895 – Bearish Transition Zone.
This transition zone represents a major accumulation and demand area that initiated the broader bullish move. Strong buying interest emerged from this zone, leading to the current upside expansion. As long as price remains well above this area, long term bullish structure stays firmly intact.
4061–4125 – Bullish Transition Zone.
The second transition zone acted as a key consolidation and breakout base before the recent acceleration higher. Price acceptance above this zone confirms strong bullish continuation. Any pullback into this region would likely attract renewed buying interest.
🔹 Dynamic Support/Resistance Levels:
Price: 3942
The 3942 level functions as a critical medium term dynamic support, aligning with prior structural lows. Buyers have repeatedly defended this level, reinforcing market confidence. A sustained break below would be required to challenge the current bullish trend.
Price: 4139
The 4139 level has flipped into a near term dynamic support following the recent breakout. Price holding above this level suggests ongoing bullish control. Failure to maintain this level could trigger a short term corrective pullback.
🔹 Commentary:
Gold continues to display strong bullish characteristics with limited downside pressure. Momentum remains healthy, supported by clean structure and disciplined pullbacks. Buyers are clearly in control while price trades above key transition zones. Overall, XAU/USD remains well positioned for further bullish continuation under current conditions.
WTI (Crude Oil)
🔹 Overall Sentiment:
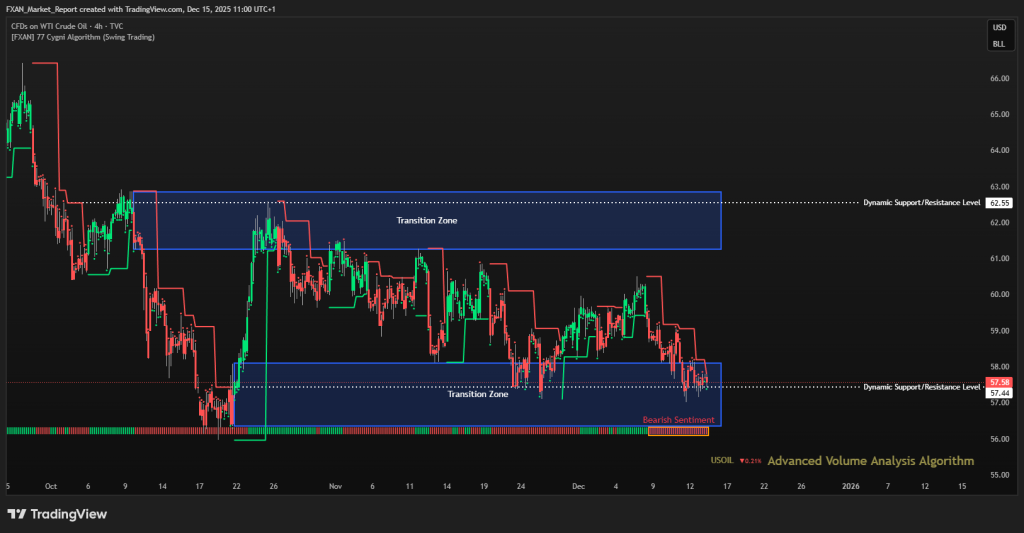
Bearish – WTI remains under bearish sentiment for the last eight days, with price continuing to trade below key resistance levels. Selling pressure has dominated recent sessions, preventing any sustained bullish recovery. The structure shows lower highs, confirming bearish continuation rather than a corrective bounce. Overall momentum still favors sellers at current levels.
🔹 Transition Zones:
61.25–62.85 – Bearish Transition Zone.
This upper transition zone represents a strong supply and rejection area, where sellers have repeatedly stepped in. Previous attempts to reclaim this zone have failed, reinforcing it as a key bearish control area. A move back into this zone would likely face heavy resistance.
56.35–58.10 – Bullish Transition Zone.
The lower transition zone is currently acting as a critical decision area between continuation and stabilization. Price is trading within this range, showing signs of short term consolidation rather than reversal. A clean break below would open the door for further downside continuation.
🔹 Dynamic Support/Resistance Levels:
Price: 62.55
The 62.55 level remains a major dynamic resistance, aligned with previous swing highs. Sellers have consistently defended this level, keeping price capped below. A sustained break above would be required to shift medium term sentiment.
Price: 57.44
The 57.44 level is acting as an important near term dynamic support. Price is currently hovering just above this level, making it a key short term inflection point. A decisive breakdown would likely accelerate bearish momentum.
🔹 Commentary:
WTI continues to show weak structure with limited bullish follow through. Price behavior suggests sellers remain firmly in control while trading below upper transition zones. The market is approaching a critical support area where volatility may increase. Overall bias stays bearish unless clear structural recovery develops.
S&P 500
🔹 Overall Sentiment:
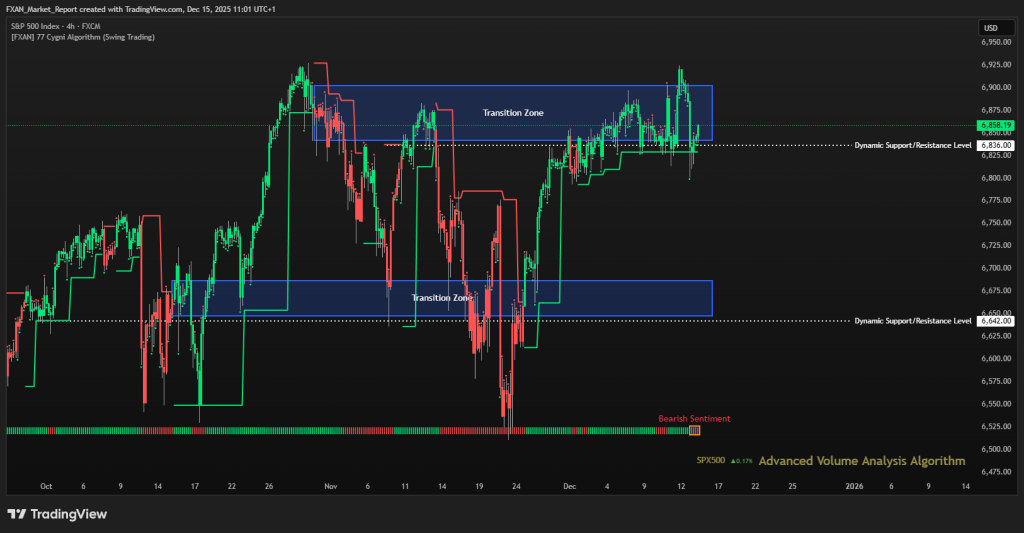
Bearish – The S&P 500 has shifted into bearish sentiment over the last three days, with price failing to sustain acceptance above key resistance. Recent price action shows increased volatility and rejection from higher levels, suggesting weakening bullish momentum. Sellers have begun to regain short term control as the index trades near a critical inflection area. Overall structure points to caution while price remains below upper resistance.
🔹 Transition Zones:
6648–6687 – Bullish Transition Zone.
This lower transition zone represents a strong demand area, previously acting as a base for bullish continuation. Price reactions from this zone have historically produced sharp rebounds, highlighting active buyer interest. A return into this range would be closely watched for potential stabilization.
6842–6902 – Bearish Transition Zone.
The upper transition zone is currently acting as a distribution and rejection zone. Multiple failures to hold above this area reinforce it as a key supply region. Sustained trading within this zone remains unlikely without renewed bullish strength.
🔹 Dynamic Support/Resistance Levels:
The 6642 level serves as a major dynamic support, aligned with prior structural lows. Holding above this level keeps the broader bullish structure intact. A decisive breakdown would significantly increase downside risk.
Price: 6836
The 6836 level is acting as near term dynamic resistance, capping recent upside attempts. Price is currently oscillating around this level, indicating indecision. Acceptance above it would be required to negate the current bearish bias.
🔹 Commentary:
The S&P 500 is currently trading in a sensitive technical area between major support and resistance. Short term momentum has softened, increasing the probability of consolidation or a corrective move. Market participants are likely waiting for clearer direction before committing aggressively. Until price reclaims higher ground, the near term bias remains cautiously bearish.
BTC/USD (Bitcoin)

🔹 Overall Sentiment:
Bullish – BTC/USD has shifted into a bullish sentiment over the last day, despite price trading below a key dynamic resistance level. The market appears to be stabilizing after the prior corrective phase, with buyers defending lower levels effectively. While upside momentum is still developing, selling pressure has clearly weakened. Overall structure suggests a potential base formation rather than trend continuation to the downside.
🔹 Transition Zones:
103,200 – 105,500 – Bearish Transition Zone.
The lower transition zone acts as a key accumulation and demand area. Price has previously reacted positively from this zone, leading to short term recoveries. Sustained acceptance above this region supports the current bullish short term biass.
84,300 – 86,450 – Bullish Transition Zone.
he 107450 level remains a major dynamic resistance, defining the upper boundary of the broader bearish structure. Price rejection from this level has historically triggered sharp pullbacks. A clean break and hold above it would signal a significant trend shift.
🔹 Dynamic Support/Resistance Levels:
Price: 107,450
The 107450 level remains a key dynamic resistance, capping upside attempts in the broader structure. A clean break and acceptance above this level would significantly strengthen bullish continuation. Until then, it remains a critical upside barrier.
Price: 93,075
The 93075 level is acting as near term dynamic resistance, currently capping upside attempts. Price trading below this level keeps bullish momentum limited in the short term. Reclaiming it would strengthen confidence in further upside development.
🔹 Commentary:
BTC/USD is currently trading in a recovery phase, attempting to build structure after a deep correction. Market conditions suggest cautious optimism rather than aggressive bullish continuation. Volume and follow through will be critical to confirm any sustained move higher. Until key resistance levels are reclaimed, price action remains vulnerable to consolidation or minor pullbacks.