
EUR/USD
🔹 Overall Sentiment:
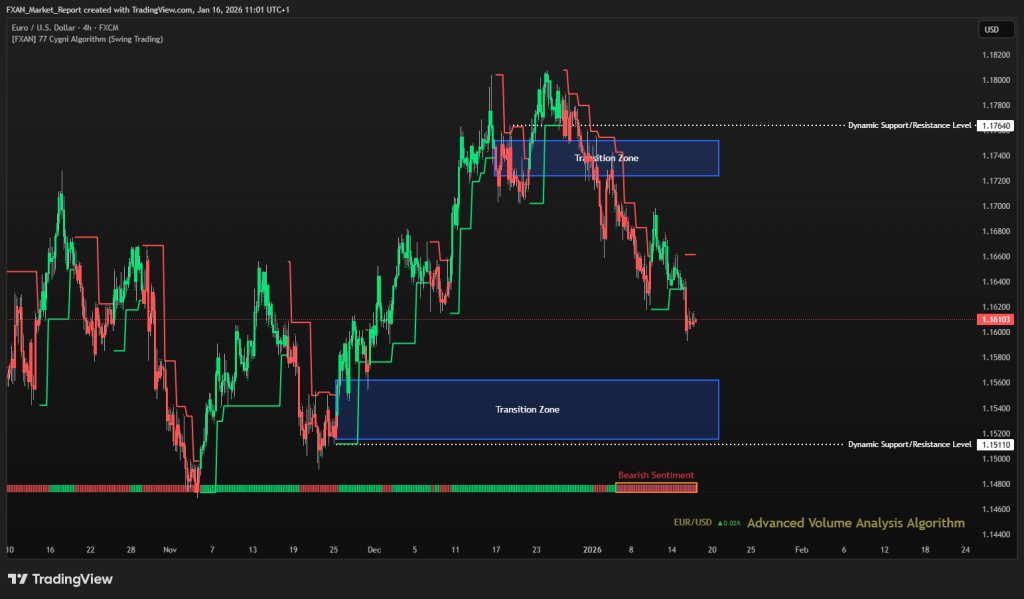
Bearish – EUR/USD has remained in a bearish sentiment for more than a week, with price continuing to trend lower under sustained selling pressure. The pair has failed to reclaim prior resistance, resulting in a clear sequence of lower highs and lower lows. Bearish momentum remains steady rather than aggressive, suggesting controlled downside continuation. As long as price stays below key resistance, the bearish bias remains intact.
🔹 Transition Zones:
1.15150 – 1.15620 – Bullish Transition Zone.
This lower transition zone represents a significant demand area where buyers previously stepped in with strength. A move into this zone could slow the decline and trigger a short term corrective bounce, though confirmation would be needed to suggest a broader shift in sentiment.
1.17240 – 1.17520 – Bearish Transition Zone.
This upper transition zone continues to act as a strong supply area and has repeatedly rejected price. Failure to reclaim this zone confirms ongoing seller dominance and reinforces the bearish structure.
🔹 Dynamic Support/Resistance Levels:
Price: 1.15110
Level 1 at 1.15110 functions as a key dynamic support aligned with the lower transition zone. A decisive break below this level would increase the probability of further downside extension.
Price: 1.17640
Level 2 at 1.17640 serves as dynamic resistance, and continued rejection here maintains bearish control. A sustained break above this level would be required to weaken the current bearish outlook.
🔹 Commentary:
Price is currently trading below the upper transition zone, confirming sustained bearish control. Selling pressure remains consistent, suggesting continuation rather than exhaustion. Any short term bullish attempts are likely to remain corrective while below resistance. Traders should monitor reactions near dynamic support for confirmation of continuation or early signs of stabilization.
GBP/USD
🔹 Overall Sentiment:
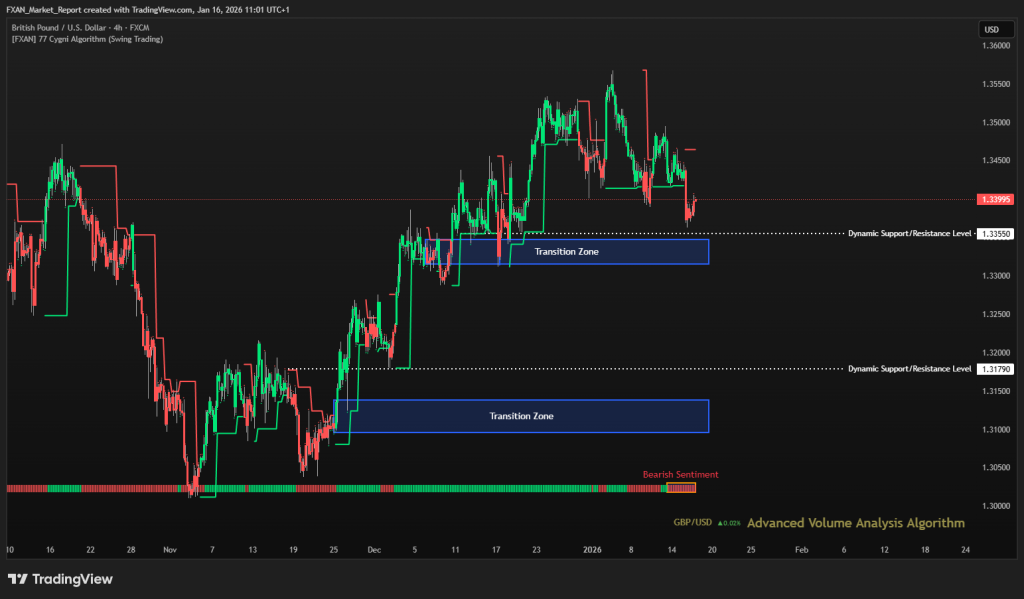
Bearish – GBP/USD has shifted into a bearish sentiment over the last two days, with price losing bullish structure after failing to sustain higher levels. Sellers have regained control as the pair broke below short term support and continued to post lower highs. Momentum remains moderately bearish, indicating controlled downside rather than panic selling. As long as price remains below key resistance, downside risk persists.
🔹 Transition Zones:
1.30960 – 1.31380– Bullish Transition Zone.
This lower transition zone represents a strong historical demand area where buyers previously absorbed selling pressure. If price revisits this zone, it could act as a stabilization area and potentially trigger a corrective rebound.
1.33150 – 1.33470– Bearish Transition Zone.
The upper transition zone has now flipped into a supply area following the recent rejection. Failure to reclaim and hold above this zone confirms ongoing bearish pressure and reinforces seller dominance.
🔹 Dynamic Support/Resistance Levels:
Price: 1.31790
Level 1 at 1.31790 serves as an important dynamic support aligned with prior accumulation. A clean break below this level would likely open the door for deeper downside continuation.
Price: 1.33550
Level 2 at 1.33550 acts as dynamic resistance, and repeated rejection here keeps bearish momentum intact. Only a sustained move above this level would weaken the current bearish bias.
🔹 Commentary:
Price is currently trading below the upper transition zone, confirming sellers remain in control. Short term pullbacks appear corrective rather than impulsive, suggesting continuation risk remains. Bearish momentum is steady but not aggressive, allowing for brief consolidations. Traders should monitor reactions near dynamic support for signs of either continuation or short term stabilization.
GOLD (XAU/USD)
🔹 Overall Sentiment:
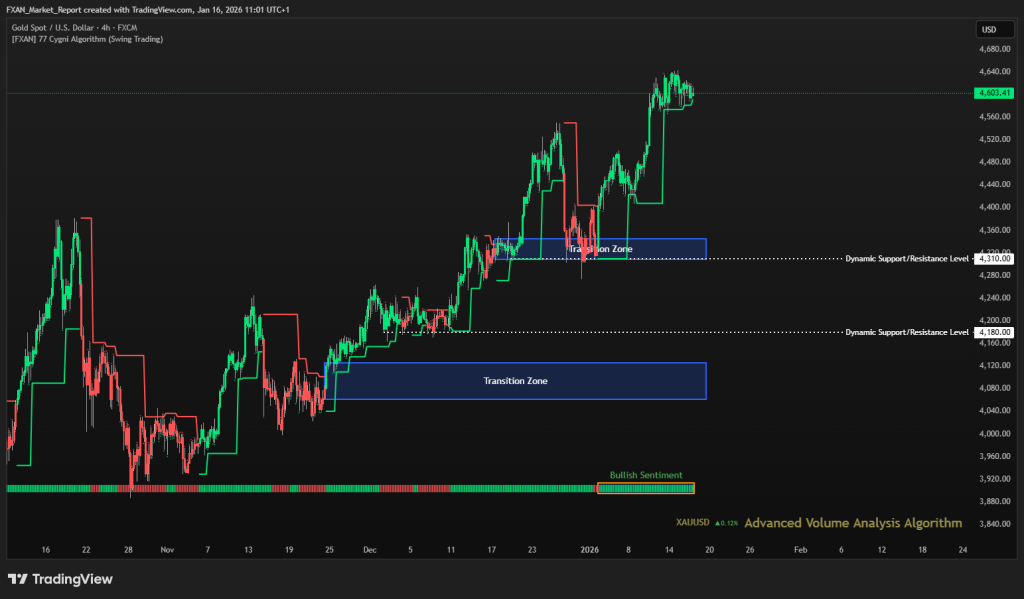
Bullish – XAU/USD has maintained a bullish sentiment for almost two weeks, supported by strong upside continuation and sustained buyer dominance. Price continues to trade above key support structures, confirming a healthy bullish trend rather than an exhausted move. Pullbacks have been shallow and corrective, indicating strong underlying demand. As long as price holds above key support levels, the bullish bias remains firmly intact.
🔹 Transition Zones:
4061 – 4125 – Bullish Transition Zone.
This lower transition zone represents a major accumulation area where buyers previously entered aggressively. A revisit of this zone would likely attract strong demand and act as a foundation for trend continuation.
4308 – 4345 – Bullish Transition Zone.
The upper transition zone has already been successfully reclaimed and respected as support. Holding above this zone confirms bullish control and strengthens the probability of further upside extension.
🔹 Dynamic Support/Resistance Levels:
Price: 4180
Level 1 at 4180 acts as a key dynamic support aligned with the broader bullish structure. A sustained move below this level would be required to weaken the current bullish trend.
Price: 4310
Level 2 at 4310 now functions as dynamic support after the breakout, and continued acceptance above this level reinforces bullish continuation.
🔹 Commentary:
Price is currently trading well above the upper transition zone, confirming strong momentum. Bullish sentiment remains stable with no clear signs of distribution or exhaustion. Any short term pullbacks are likely to be corrective rather than trend reversing. Traders should continue monitoring reactions near dynamic support levels for confirmation of trend strength.
WTI (Crude Oil)
🔹 Overall Sentiment:
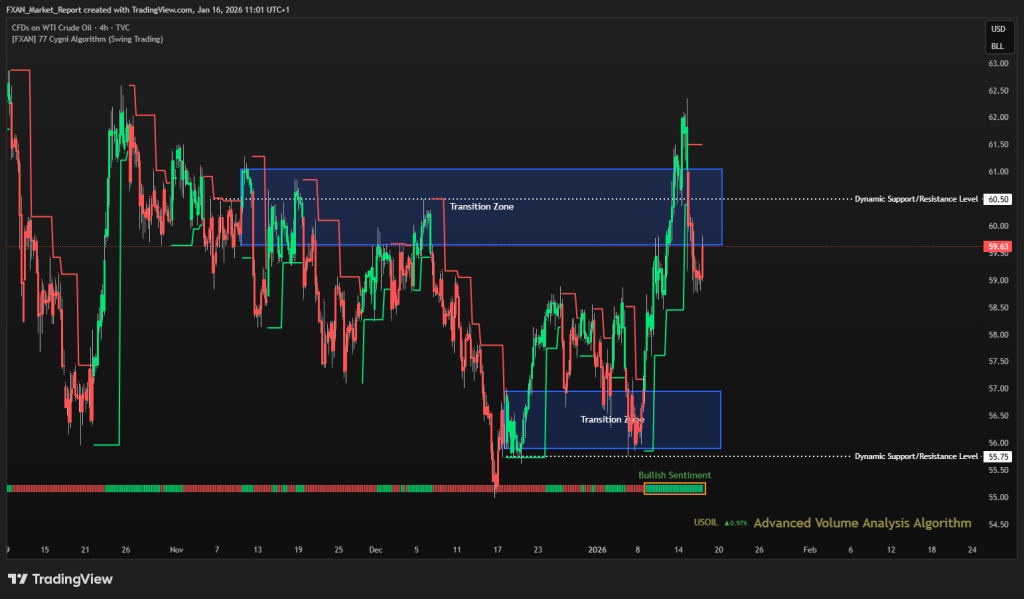
Bullish – WTI Crude Oil has sustained a bullish sentiment for more than a week, supported by strong recovery from recent lows and clear buyer initiative. Price has shifted structure to the upside, breaking above prior consolidation areas and holding higher lows. Momentum remains constructive, although recent volatility suggests short term consolidation is possible. As long as price remains above key support, the bullish bias stays valid.
🔹 Transition Zones:
59.65 – 61.05 – Bullish Transition Zone.
This upper transition zone represents a major supply area where price has previously struggled to sustain upside momentum. A clean acceptance above this zone would confirm trend continuation, while rejection could lead to short term pullbacks.
55.90 – 56.95 – Bullish Transition Zone.
The lower transition zone acted as a strong accumulation area and marked the base for the current bullish leg. Any pullback into this zone would likely attract buyers and support further upside attempts.
🔹 Dynamic Support/Resistance Levels:
Price: 60.50
Level 1 at 60.50 functions as a key dynamic resistance aligned with the upper transition zone. A decisive break and hold above this level would significantly strengthen the bullish outlook.
Price: 55.75
Level 2 at 55.75 serves as dynamic support and defines the broader bullish structure. Holding above this level keeps the medium term trend intact.
🔹 Commentary:
Price is currently consolidating just below the upper transition zone, indicating a pause rather than weakness. Bullish momentum remains present, though short term pullbacks may occur as price digests recent gains. Buyers continue to defend higher lows, reinforcing trend strength. Monitoring price behavior around the upper transition zone will be key for confirmation of continuation or consolidation.
S&P 500
🔹 Overall Sentiment:
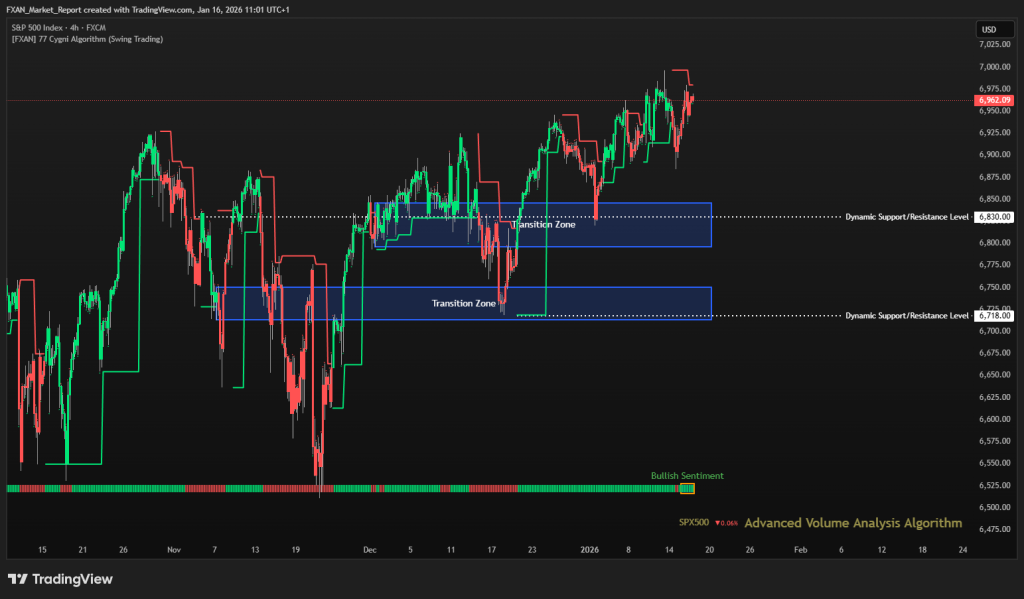
Bullish – The S&P 500 is showing a bullish sentiment over the last day, supported by strong upside continuation and sustained buying pressure. Price remains well above key structural levels, reinforcing positive short term momentum. The market is holding higher highs and higher lows, suggesting trend stability. As long as price holds above key supports, bullish conditions remain intact.
🔹 Transition Zones:
6713 – 6750 – Bearish Transition Zone.
This zone represents a deeper demand area that previously attracted strong buying interest. Any corrective move into this range would likely be viewed as a dip buying opportunity rather than trend reversal.
6796 – 6846 – Bullish Transition Zone.
The second transition zone acts as a mid structure support and former consolidation area. Holding above this zone confirms bullish control and supports continuation toward higher price levels.
🔹 Dynamic Support/Resistance Levels:
Level 1 at 6830 is a critical dynamic support that aligns with recent breakout structure. Sustained acceptance above this level strengthens bullish continuation potential.
Price: 6718
Level 2 at 6718 marks a major structural support and defines the lower boundary of the bullish trend. A break below this level would weaken the current bullish outlook.
🔹 Commentary:
Price is currently trading comfortably above both transition zones, signaling strong market confidence. Momentum remains positive, though short term pauses or shallow pullbacks are possible after recent gains. Buyers continue to defend key levels effectively, keeping downside risk limited. Overall structure favors further upside as long as price remains above dynamic support.
BTC/USD (Bitcoin)
🔹 Overall Sentiment:
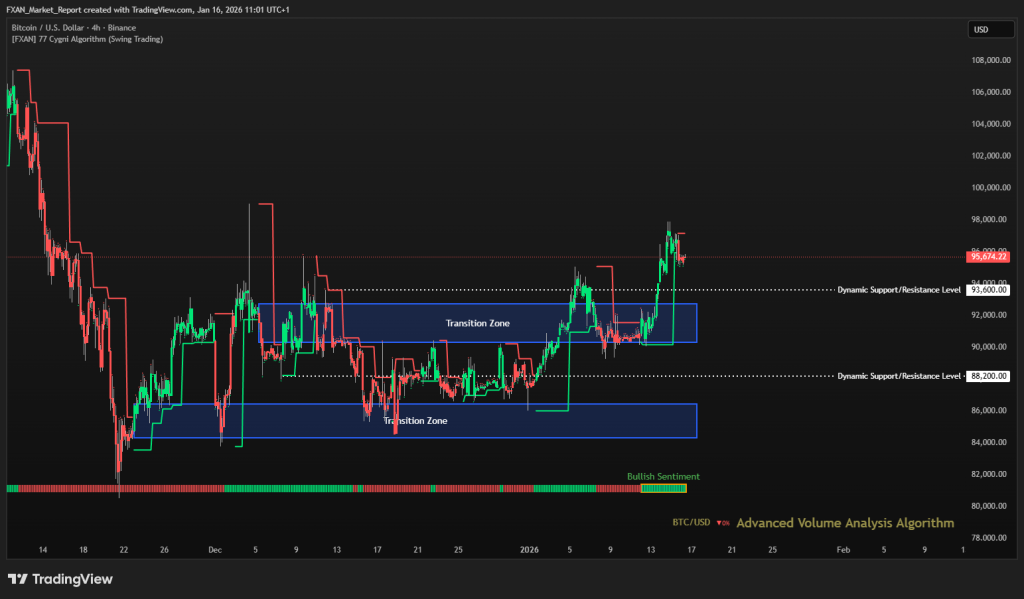
Bullish – BTC/USD is maintaining a bullish sentiment over the last five days, supported by strong upward momentum and sustained buying pressure. Price has successfully pushed above prior resistance, confirming bullish continuation. Higher highs and higher lows remain intact, reinforcing trend strength. As long as price holds above key support, the bullish bias remains valid.
🔹 Transition Zones:
84,300 – 86,450 – Bullish Transition Zone.
This lower transition zone represents a major demand area where buyers previously stepped in aggressively. Any deeper pullback into this zone would likely attract renewed buying interest rather than signal a trend reversal..
90,650 – 93,050– Bullish Transition Zone.
The second transition zone acted as a key consolidation and breakout area. Holding above this zone confirms strong bullish control and supports continuation toward higher price levels..
🔹 Dynamic Support/Resistance Levels:
Price: 88,200
Level 1 at 88,200 is a critical dynamic support and defines the lower boundary of the current bullish structure. Sustained acceptance above this level keeps downside risk limited.
Price: 93,600
above this level strengthens the case for further upside continuation.
🔹 Commentary:
Price is currently trading well above both transition zones, reflecting strong market confidence. Short term consolidation or shallow pullbacks are possible after recent gains, but overall structure remains constructive. Buyers continue to defend key levels effectively, limiting bearish pressure. The broader outlook remains bullish as long as price holds above dynamic support.