
EUR/USD
🔹 Overall Sentiment:
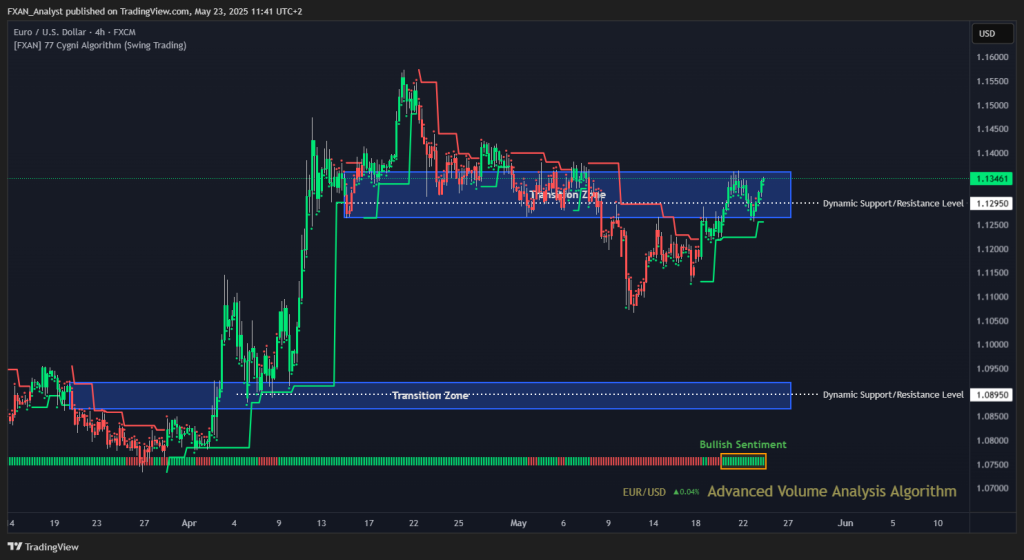
Bullish – EUR/USD continues its bullish sentiment, supported by the green-colored bar on the Cygni 77 algorithm. Volume analysis confirms sustained buying pressure, pushing prices higher within a key resistance zone.
🔹 Transition Zones:
1.08650 – 1.09200 – Bearish Transition Zone.
This lower zone remains a significant support level, where buyers have previously stepped in, helping to shift sentiment from bearish to bullish.
1.12650 – 1.13600 – Bearish Transition Zone.
Currently acting as resistance, this zone is critical as the price is trading near its upper boundary. Volume dynamics will determine if buyers can break through or if sellers will regain control.
🔹 Dynamic Support/Resistance Levels:
Price: 1.08950
A key dynamic support level where volume clusters indicate buyer interest, essential for maintaining bullish momentum.
Price: 1.12950
This resistance level is being tested, with volume suggesting a potential battle between buyers and sellers. A breakout above this level with volume confirmation could lead to further gains.
🔹 Commentary:
EUR/USD is holding a bullish stance, with volume-driven buying pushing the price into a challenging transition zone. Traders should closely monitor volume and price action around the 1.12950 resistance level to assess the potential for breakout or rejection. Maintaining support at 1.08950 remains vital to avoid a sentiment shift. Overall, the volume analysis supports a cautiously optimistic outlook with potential for continued upside if resistance is overcome.
GBP/USD
🔹 Overall Sentiment:
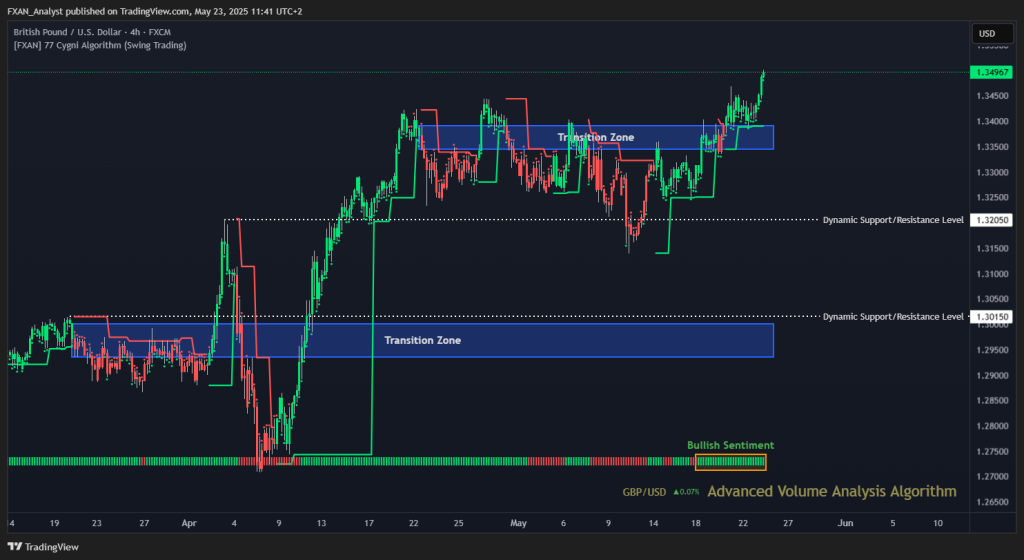
Bullish – GBP/USD continues its bullish momentum, supported by the green-colored bar on the Cygni 77 algorithm. Volume dynamics show sustained buyer interest, driving the price to new highs above a key resistance zone.
🔹 Transition Zones:
1.29350 – 1.30000 – Bearish Transition Zone.
This zone remains a critical support level, where buyers have consistently entered to defend the bullish trend, confirmed by volume clusters.
1.33450 – 1.33900 – Bearish Transition Zone.
The price has now broken above this zone, which previously acted as resistance. Volume analysis suggests this breakout confirms strengthening bullish momentum, with this zone potentially turning into support.
🔹 Dynamic Support/Resistance Levels:
Price: 1.30150
This dynamic support level has proven to be a reliable floor during recent corrections, underpinned by volume support.
Price: 1.32050
Previously a resistance level, this dynamic price is now an important support area. Holding above this level is crucial for sustaining the bullish trend.
🔹 Commentary:
GBP/USD is showing robust bullish strength, with volume dynamics confirming buyer dominance. The recent breakout above the 1.33450 – 1.33900 transition zone suggests a potential continuation of the upward move. Traders should monitor these former resistance levels as new support zones. Maintaining volume-backed support at 1.30150 and 1.32050 is key to avoiding pullbacks. Overall, the volume profile supports a confident bullish outlook for GBP/USD.
GOLD (XAU/USD)
🔹 Overall Sentiment:
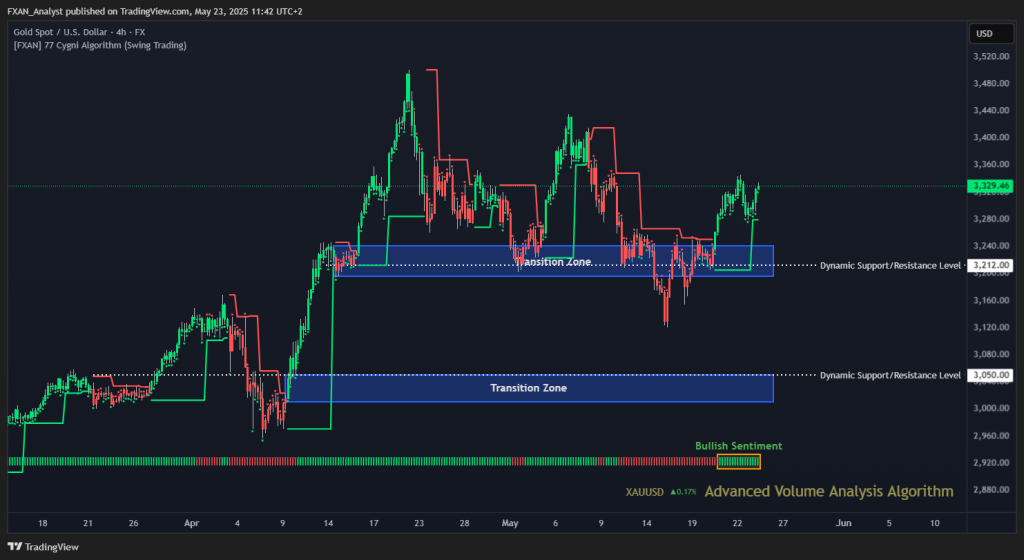
Bullish – XAU/USD continues to exhibit bullish sentiment, supported by the green-colored bar on the Cygni 77 algorithm. Volume dynamics confirm renewed buying interest, driving prices higher from key support zones.
🔹 Transition Zones:
3010 – 3050 – Bullish Transition Zone.
This zone acts as a critical support level where buyers have stepped in to halt previous declines, confirmed by strong volume clusters.
3195 – 3240 – Bearish Transition Zone.
Previously a resistance zone, the price has successfully broken above this level. Volume analysis suggests this area may now serve as support, confirming a bullish shift.
🔹 Dynamic Support/Resistance Levels:
Price: 3212
Key dynamic support level, reinforced by volume activity signaling buyer presence.
Price: 3050
This resistance level has turned into an important support zone, crucial for maintaining the bullish momentum.
🔹 Commentary:
XAU/USD is showing sustained bullish momentum, with volume dynamics supporting continued upward movement. The price remains above the important transition zone of 3195 – 3240, which now serves as support. Traders should watch for price action and volume near the dynamic support levels at 3050 and 3212, as these will be key for determining the strength and continuation of the bullish trend.
WTI (Crude Oil)
🔹 Overall Sentiment:
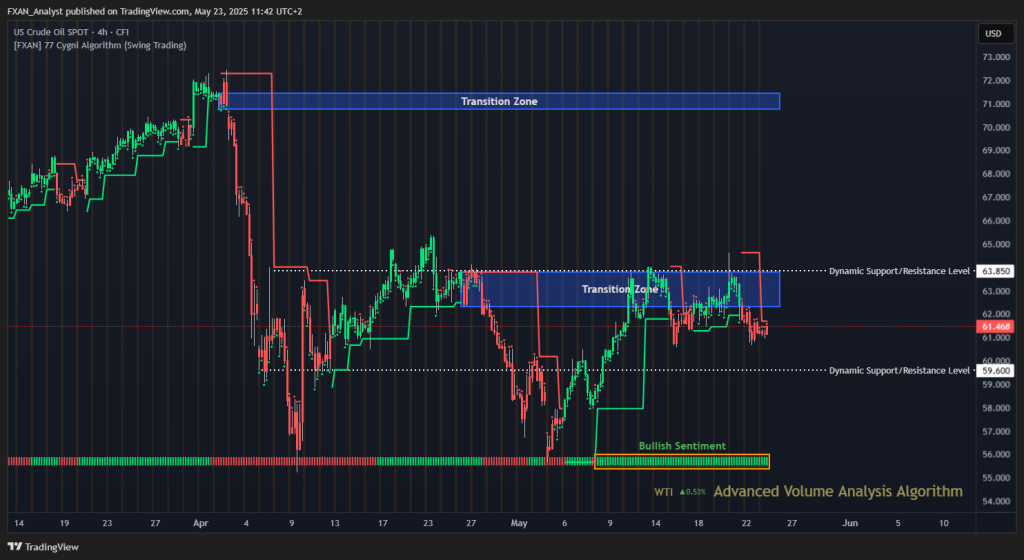
Bullish – Despite a slight pullback, WTI remains under bullish sentiment as confirmed by the green bar on the Cygni 77 algorithm. Volume dynamics indicate that buying pressure is still present, although some consolidation is occurring near key resistance levels.
🔹 Transition Zones:
62.300 – 63.800 – Bearish Transition Zone.
This zone has acted as a key resistance area recently. The price has tested it multiple times but failed to break decisively, signaling potential selling pressure in this range.
70.750 – 71.450 – Bearish Transition Zone.
This upper zone remains an important resistance target for the bullish move. A breakthrough above this level would signal a stronger bullish reversal.
🔹 Dynamic Support/Resistance Levels:
Price: 59.600
A critical dynamic support level, providing a foundation for buyers if the price retraces.
Price: 63.850
This dynamic resistance level has proven significant recently. Failure to breach this level could mean continued consolidation or minor pullbacks.
🔹 Commentary:
WTI is currently in a phase of consolidation after recent bullish momentum. Volume dynamics suggest that buyers remain active, but resistance at the 62.300 – 63.800 zone is limiting further upward movement. The support level at 59.600 is crucial to maintain the bullish outlook. Traders should watch for a decisive break above 63.850 for confirmation of renewed upside momentum.
S&P 500
🔹 Overall Sentiment:
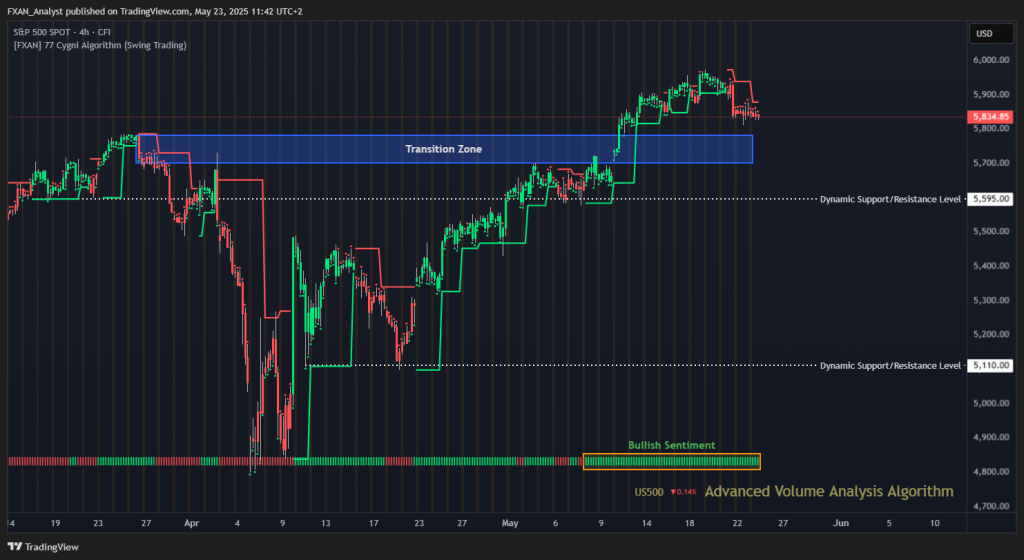
Bullish – The sentiment remains positive with the volume dynamics indicator showing continued buying interest. However, recent price action indicates some minor pullback or consolidation within key levels.
🔹 Transition Zones:
5700 – 5780 – Bearish Transition Zone.
This range continues to act as a significant support zone where buyers have consistently defended the price.
🔹 Dynamic Support/Resistance Levels:
Price: 5110
Key dynamic support level, providing a strong base in case of deeper retracements.
Price: 5595
Intermediate dynamic support level, acting as a floor before the transition zone.
🔹 Commentary:
The S&P 500 maintains a bullish bias supported by volume analysis, with buyers active above the transition zone. Traders should watch for any sustained breaks below 5700 for a shift in momentum or increased volatility. Maintaining above this zone could provide further upside opportunities.
BTC/USD (Bitcoin)
🔹 Overall Sentiment:
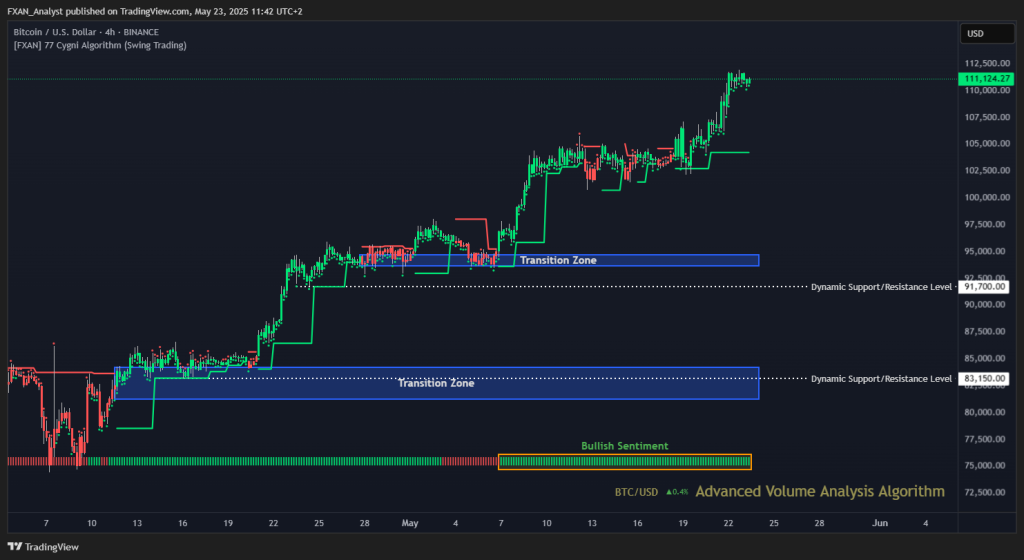
Bullish – BTC/USD remains in a strong bullish trend, as indicated by the green-colored bar on the Cygni 77 algorithm. Volume dynamics show sustained buying pressure, supporting continued upward momentum.
🔹 Transition Zones:
81,200 – 84,200 – Bullish Transition Zone.
This zone continues to act as a foundational support area, where buyers have consistently entered, reinforcing the bullish trend. Volume confirms its significance as a base for further upward moves.
93,650 – 94,675 – Bearish Transition Zone.
This zone, previously resistance, now serves as a crucial support level. Price consolidation above this zone is supported by volume, indicating a stable base for continued bullish momentum.
🔹 Dynamic Support/Resistance Levels:
Price: 83,150
A key dynamic support level reinforced by volume activity, essential for maintaining the bullish structure during corrections.
Price: 91,700
This resistance-turned-support level remains pivotal. A break and hold above this level, with strong volume, would likely propel BTC/USD toward new highs.
🔹 Commentary:
BTC/USD’s bullish momentum remains intact, supported by volume analysis confirming buyer dominance. The market is consolidating above critical transition zones, providing a solid foundation for further gains. Traders should monitor volume near the 91,700 level to anticipate potential breakouts. Maintaining support at 83,150 is vital for risk management and continuation of the upward trend.