
EUR/USD
🔹 Overall Sentiment:
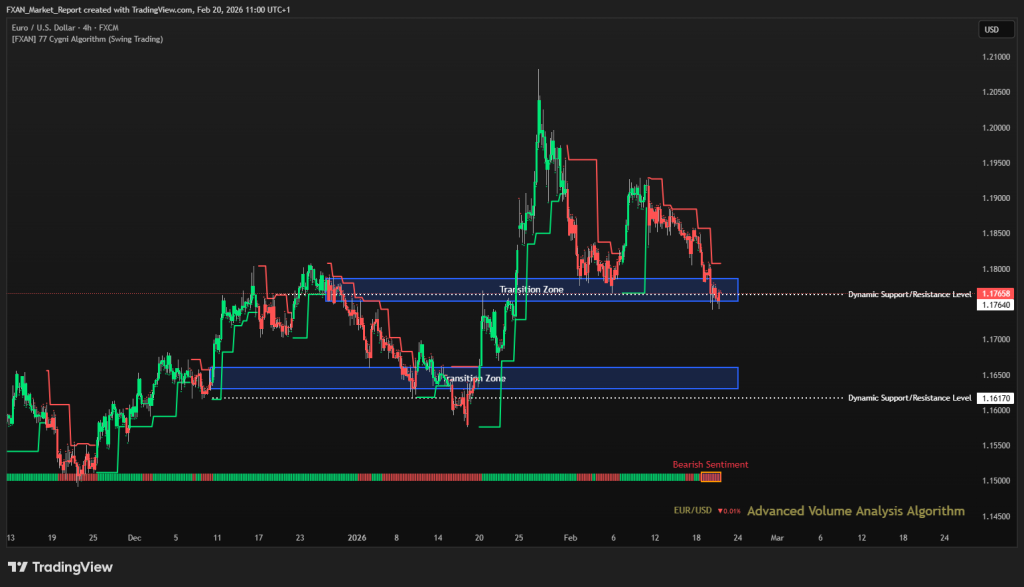
Bearish – EUR/USD has shifted into a bearish sentiment over the last two days, with price losing short term upward momentum. The pair is now trading back inside a prior transition zone, signaling fading bullish pressure. Sellers are becoming more active near recent highs. The short term bias favors further corrective downside while below resistance.
🔹 Transition Zones:
1.16300 to 1.16600 – Bullish Transition Zone.
This lower zone represents a key structural demand area from the broader bullish move. A retest of this region could attract renewed buying interest if bearish pressure slows.
1.17540 to 1.17865 – Bearish Transition Zone.
Price is currently interacting with this upper transition zone, which is acting as resistance. Failure to hold above it reinforces short term bearish control.
🔹 Dynamic Support/Resistance Levels:
Price: 1.17640
This level now acts as immediate resistance after the recent breakdown. Sustained trading below it confirms weakening upside structure.
Price: 1.16170
This level marks deeper structural support. A decisive break below it would open the door for broader downside continuation.
🔹 Commentary:
Recent price action suggests profit taking after a prolonged bullish phase. Selling pressure is increasing near resistance levels. Momentum favors short term consolidation or further pullback. A recovery above dynamic resistance would be required to restore bullish bias.
GBP/USD
🔹 Overall Sentiment:
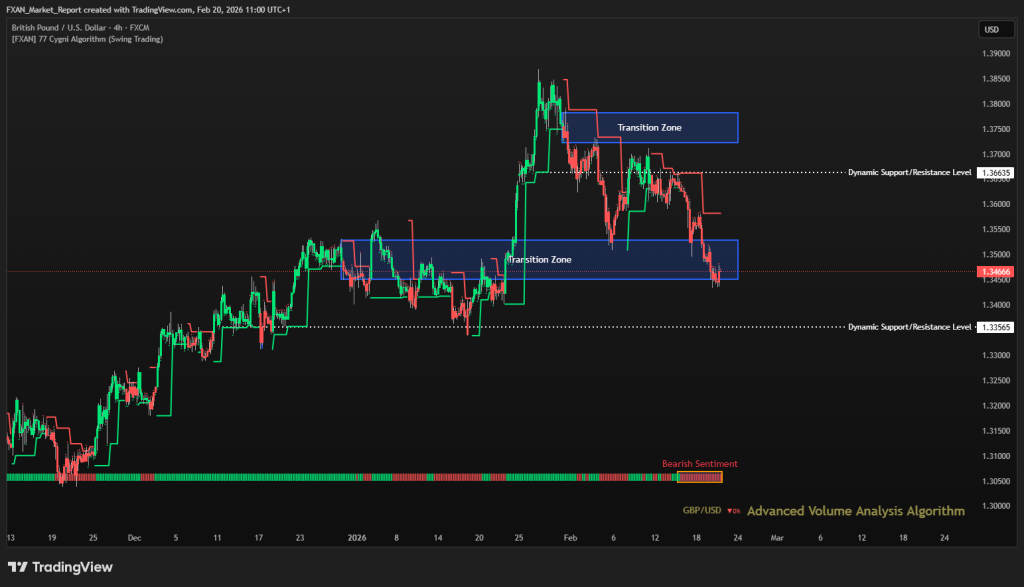
Bearish – GBP/USD maintains a bearish sentiment for the last four days, reflecting sustained downside pressure. The pair has broken below key short term supports, confirming weakening bullish structure. Sellers are defending rebounds effectively. The bias remains tilted to the downside while below dynamic resistance..
🔹 Transition Zones:
1.34515 – 1.35285– Bearish Transition Zone.
Price is currently testing this lower transition zone, which represents a key support region. Sustained acceptance below it would confirm further bearish continuation.
1.37230 – 1.37820– Bearish Transition Zone.
This upper zone remains a strong resistance cluster following previous rejection. It continues to cap upside recovery attempts.
🔹 Dynamic Support/Resistance Levels:
Price: 1.33565
This level acts as major structural support below current price. A move toward it would confirm deeper corrective momentum.
Price: 1.36635
This level now functions as dynamic resistance. Remaining below it keeps bearish pressure intact.
🔹 Commentary:
Selling activity remains consistent, with limited bullish follow through on rebounds. Price structure shows lower highs forming. Volatility favors downside movement. The bearish bias persists while price trades under resistance zones.
GOLD (XAU/USD)
🔹 Overall Sentiment:
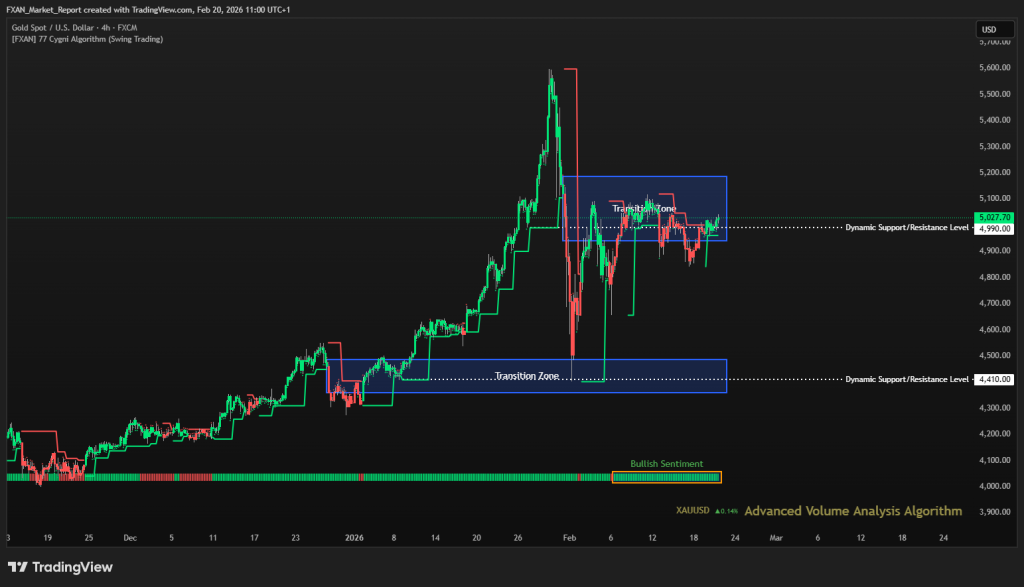
Bullish – Gold continues to maintain bullish sentiment for more than two weeks, supported by strong structural momentum. Despite short term fluctuations, the broader upward trend remains intact. Buyers continue to defend higher support levels. The overall bias favors continuation higher while key supports hold.
🔹 Transition Zones:
4360 – 4485 – Bearish Transition Zone.
This zone represents a major long term accumulation base. It remains the foundation of the broader bullish trend.
4940 – 5185 – Bearish Transition Zone.
This zone defines the active trading range near current price. Sustained trading within or above this region supports ongoing bullish momentum.
🔹 Dynamic Support/Resistance Levels:
Price: 4410
This level acts as critical structural support. A break below it would significantly weaken the bullish framework.
Price: 4990
This level functions as a near term pivot and support. Holding above it reinforces short term bullish strength.
🔹 Commentary:
Gold continues to attract buying interest on dips. Momentum remains aligned with the broader uptrend. Short term volatility has not disrupted the structural bias. Bullish continuation remains favored while dynamic support holds.
WTI (Crude Oil)
🔹 Overall Sentiment:
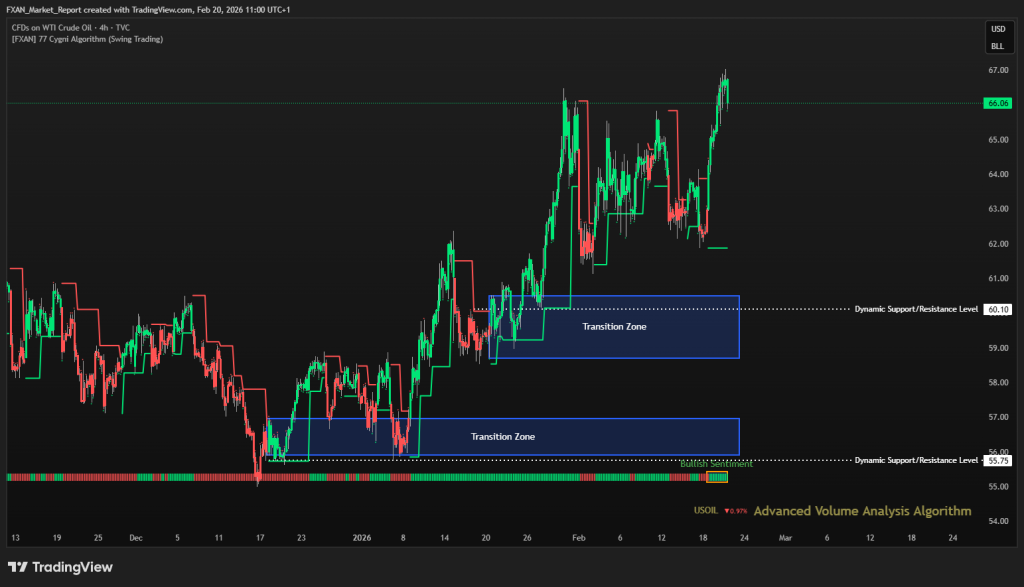
Bullish – WTI shows bullish sentiment over the last two days, supported by renewed upside pressure. Price has reclaimed key short term resistance areas. Buyers appear active following prior corrective weakness. The near term bias favors continuation higher.
🔹 Transition Zones:
55.90 – 56.95 – Bullish Transition Zone.
This lower zone remains a strong historical demand area. It represents deeper structural support in case of renewed downside pressure.
58.70 – 60.50 – Bullish Transition Zone.
This zone previously acted as consolidation and now serves as confirmed support. Sustained trading above it reinforces bullish structure.
🔹 Dynamic Support/Resistance Levels:
Price: 55.75
This level marks major structural support. A break below it would shift the broader outlook to bearish.
Price: 60.10
This level acts as dynamic support following the recent breakout. Holding above it confirms bullish momentum continuation.
🔹 Commentary:
Oil has regained upward traction after prior weakness. Buyers are stepping in at higher price levels. Momentum favors continuation rather than correction. The bullish bias remains intact while price trades above reclaimed support.
S&P 500
🔹 Overall Sentiment:
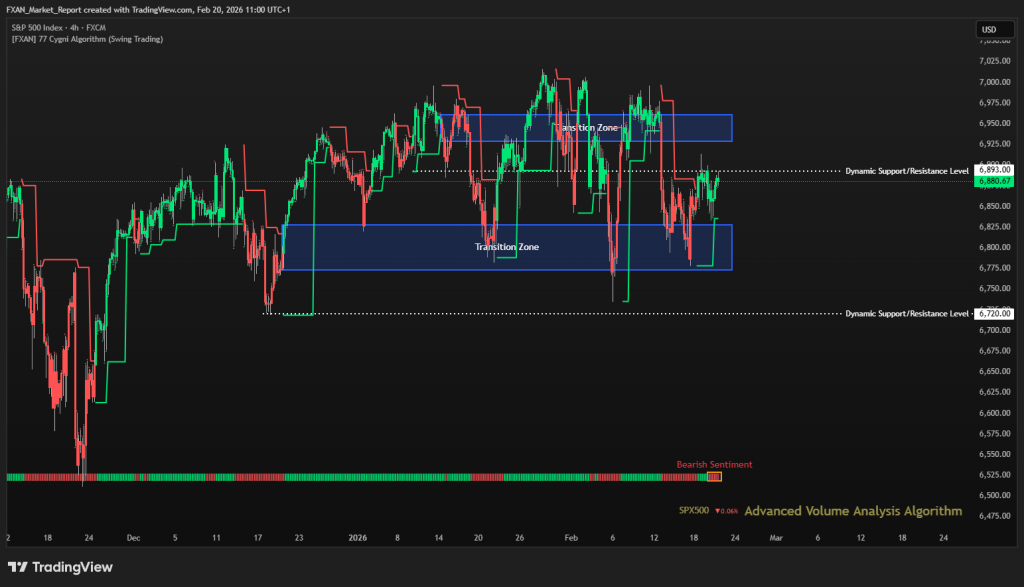
Bearish – The S&P 500 shows bearish sentiment over the last day, reflecting renewed selling pressure. Price has struggled to sustain recovery above key resistance. Sellers are defending rallies aggressively. The short term structure favors cautious downside bias.
🔹 Transition Zones:
6773 – 6828 – Bullish Transition Zone.
This zone acts as a major support cluster. Sustained trading below it would confirm broader downside risk.
6929 – 6961 – Bearish Transition Zone.
This upper zone remains a strong resistance band. Bulls would need to reclaim this region to shift momentum upward.
🔹 Dynamic Support/Resistance Levels:
Price: 6720
This level marks critical structural support beneath current price. A break below would accelerate bearish continuation.
Price: 6893
This level functions as near term resistance. Remaining below it maintains short term bearish bias.
🔹 Commentary:
Equities show hesitation with limited upside follow through. Recovery attempts lack strength and momentum. Volatility remains elevated compared to prior bullish phases. Sellers maintain control while price remains under resistance.
BTC/USD (Bitcoin)
🔹 Overall Sentiment:
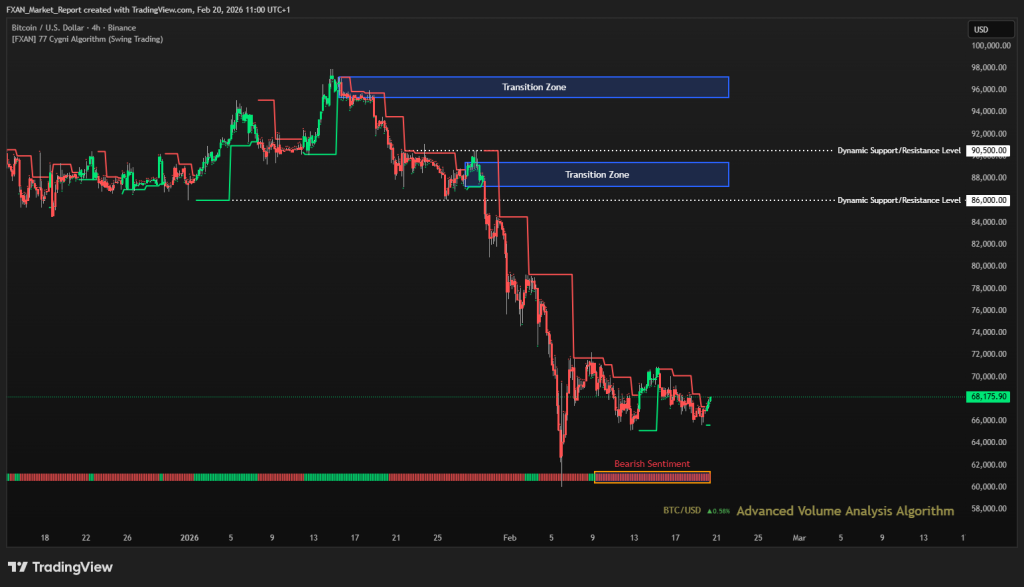
Bearish – BTC/USD maintains bearish sentiment for almost two weeks, characterized by sustained downside pressure. Lower highs and weak rebounds confirm seller dominance. The broader structure remains negative below major resistance zones. Momentum conditions continue to favor further downside risk.
🔹 Transition Zones:
95,300 – 97,150 – Bearish Transition Zone.
This zone represents a major distribution region from prior highs. It remains a strong long term resistance ceiling.
87,250 – 89,400– Bullish Transition Zone.
This zone previously served as consolidation before breakdown. It now acts as significant resistance on recovery attempts.
🔹 Dynamic Support/Resistance Levels:
Price: 88,200
This level has turned into structural resistance. Sustained trading below it confirms bearish continuation.
Price: 90,500
This higher level marks key structural resistance. A move above it would be required to shift the broader bias.
🔹 Commentary:
Bitcoin remains under consistent selling pressure. Short term bounces are corrective and lack follow through. Market structure reflects ongoing distribution. Downside risk remains elevated while price trades below resistance levels.