
EUR/USD
🔹 Overall Sentiment:
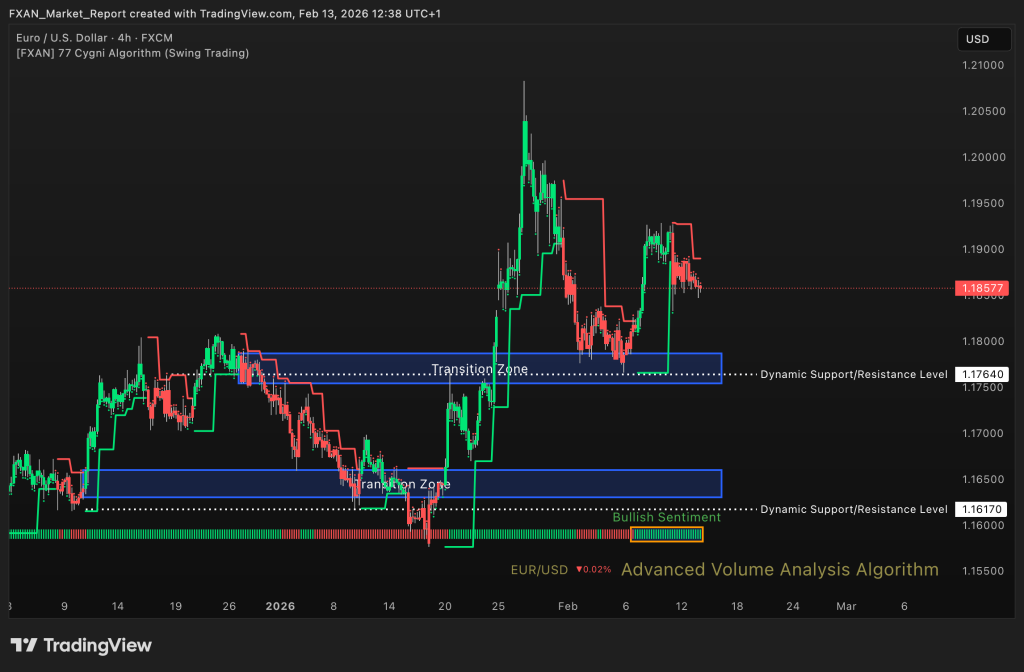
Bullish – EUR/USD maintains a bullish sentiment over the last week, with price holding firmly above reclaimed support zones. The broader structure continues to print higher highs and higher lows, confirming sustained buyer control. Pullbacks remain shallow and corrective in nature. As long as price stays above key dynamic levels, upside continuation remains favored.
🔹 Transition Zones:
1.16300 to 1.16600 – Bullish Transition Zone.
This zone represents a major structural demand base from previous consolidation. It remains a critical long term support area within the broader bullish framework.
1.17540 to 1.17865 – Bearish Transition Zone.
This zone previously acted as resistance before being reclaimed by buyers. It now serves as an important support band reinforcing the current upward structure.
🔹 Dynamic Support/Resistance Levels:
Price: 1.17640
This level functions as immediate dynamic support within the current bullish move. Holding above it confirms continued buyer strength.
Price: 1.16170
This level marks deeper structural protection for the trend. A break below would signal weakening bullish momentum.
🔹 Commentary:
Momentum remains constructive with buyers defending higher levels. The market shows strong absorption on dips rather than aggressive selling. Volatility is controlled within an upward structure. Bias remains bullish while price trades above reclaimed transition zones.
GBP/USD
🔹 Overall Sentiment:
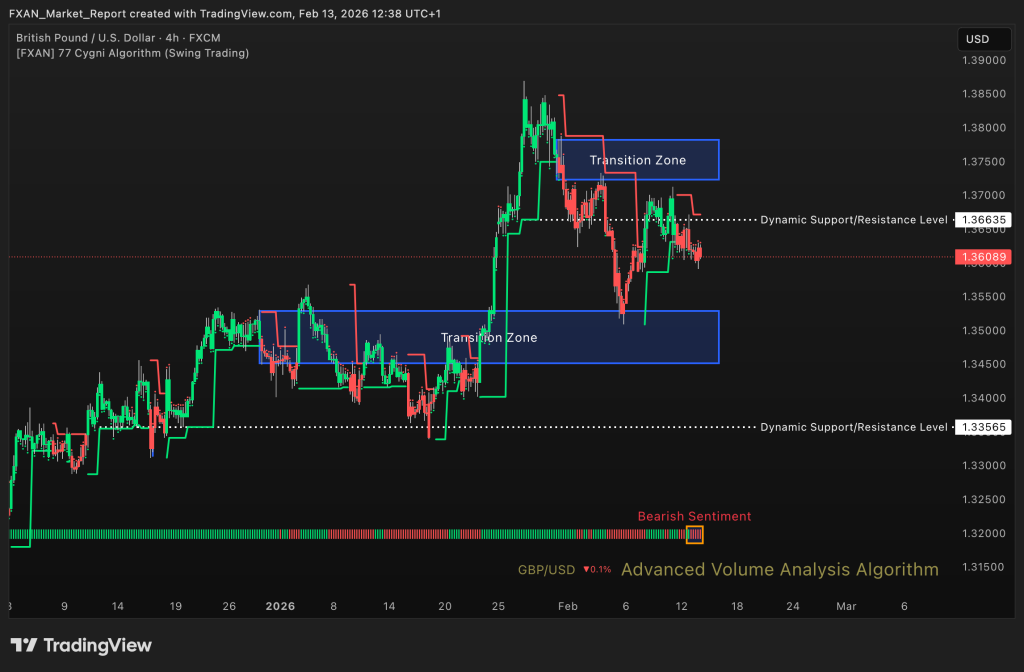
Bearish – GBP/USD has shifted into a short term bearish sentiment over the last day. Price is showing signs of exhaustion after prior upside movement. Sellers are applying pressure near resistance areas, limiting bullish continuation. The short term structure favors corrective downside movement.
🔹 Transition Zones:
1.34515 – 1.35285– Bearish Transition Zone.
This lower zone represents a key historical support region. It may attract buyers if downside pressure continues.
1.37230 – 1.37820– Bearish Transition Zone.
This upper zone remains a strong resistance cluster. Recent price rejection from this region reinforces short term bearish pressure.
🔹 Dynamic Support/Resistance Levels:
Price: 1.33565
This level acts as major structural support below current price. A move toward it would confirm deeper corrective activity.
Price: 1.36635
This level now acts as near term resistance. Price acceptance below it maintains short term bearish bias.
🔹 Commentary:
Selling pressure is visible following recent highs. Recovery attempts lack strong follow through. Price remains vulnerable below dynamic resistance. Short term downside risk persists while the pair trades under key resistance levels.
GOLD (XAU/USD)
🔹 Overall Sentiment:
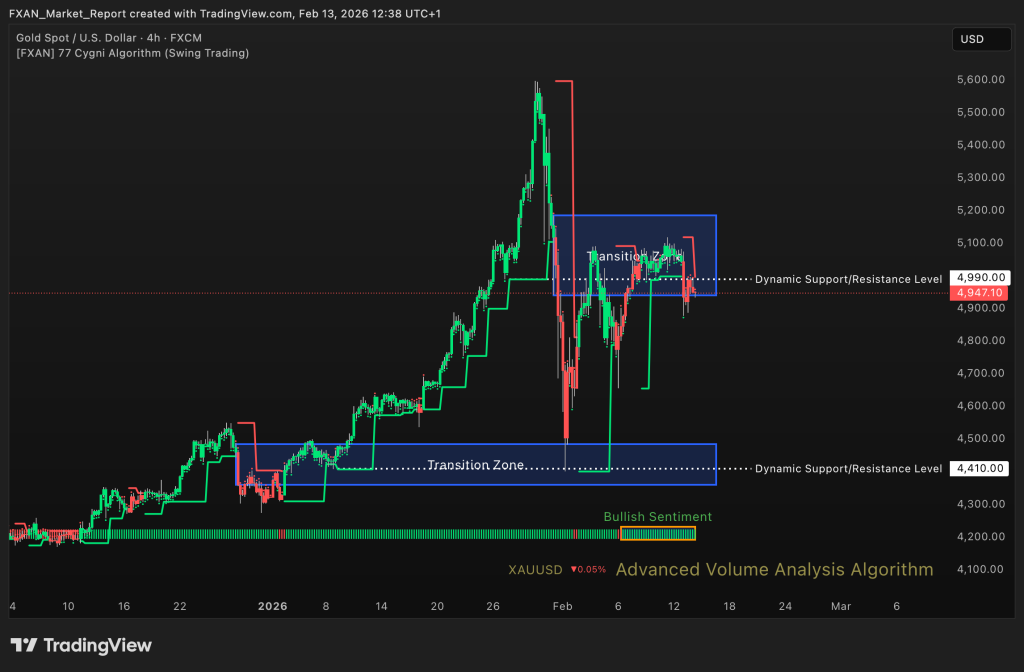
Bullish – Gold maintains a bullish sentiment for the past week, supported by strong structural momentum. Although short term volatility is present, the broader uptrend remains intact. Buyers continue defending key levels within the range. The overall bias favors continuation higher while major supports hold.
🔹 Transition Zones:
4360 – 4485 – Bearish Transition Zone.
This zone represents a strong long term accumulation area. It remains the primary structural foundation of the bullish trend.
4940 – 5185 – Bearish Transition Zone.
This zone is the active trading range where price is currently consolidating. Sustained acceptance within or above this region would confirm further bullish continuation.
🔹 Dynamic Support/Resistance Levels:
Price: 4410
This level aligns with strong structural support. A break below would significantly weaken the bullish outlook.
Price: 4990
This level acts as a near term pivot within the current range. Holding above it supports renewed upside pressure.
🔹 Commentary:
Gold continues to show resilience despite intraday pullbacks. Buyers remain active on dips within the broader structure. Momentum conditions remain constructive overall. The bullish bias remains intact as long as key supports are respected.
WTI (Crude Oil)
🔹 Overall Sentiment:
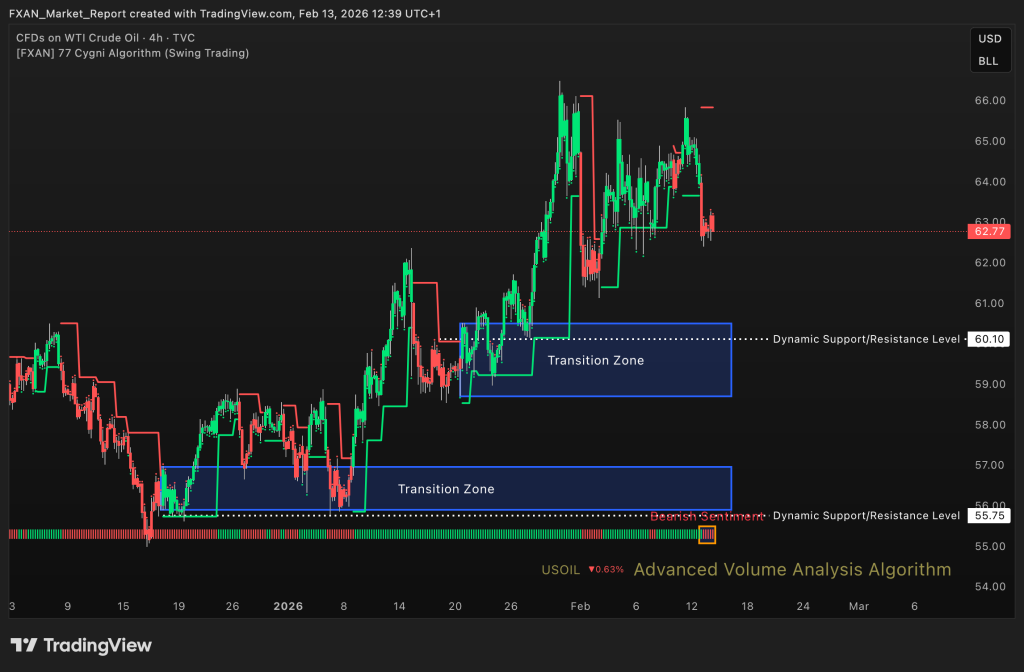
Bullish – WTI shows bearish sentiment over the last day, reflecting renewed selling pressure. Price structure suggests fading upside momentum. Sellers are defending resistance levels effectively. The short term bias leans toward further corrective downside.
🔹 Transition Zones:
55.90 – 56.95 – Bullish Transition Zone.
This lower zone represents a strong historical demand region. It may serve as a downside target if bearish momentum accelerates.
58.70 – 60.50 – Bullish Transition Zone.
This zone previously acted as consolidation support and now functions as resistance. Rejection from this area confirms ongoing seller presence.
🔹 Dynamic Support/Resistance Levels:
Price: 55.75
This level marks major structural support. A break below would signal stronger bearish continuation.
Price: 60.10
This level acts as dynamic resistance above current price. Sustained trading below it preserves short term bearish bias.
🔹 Commentary:
Oil remains under pressure with limited bullish follow through. Price struggles to maintain strength above resistance zones. Market structure suggests distribution rather than accumulation. Sellers maintain control while price remains below dynamic resistance.
S&P 500
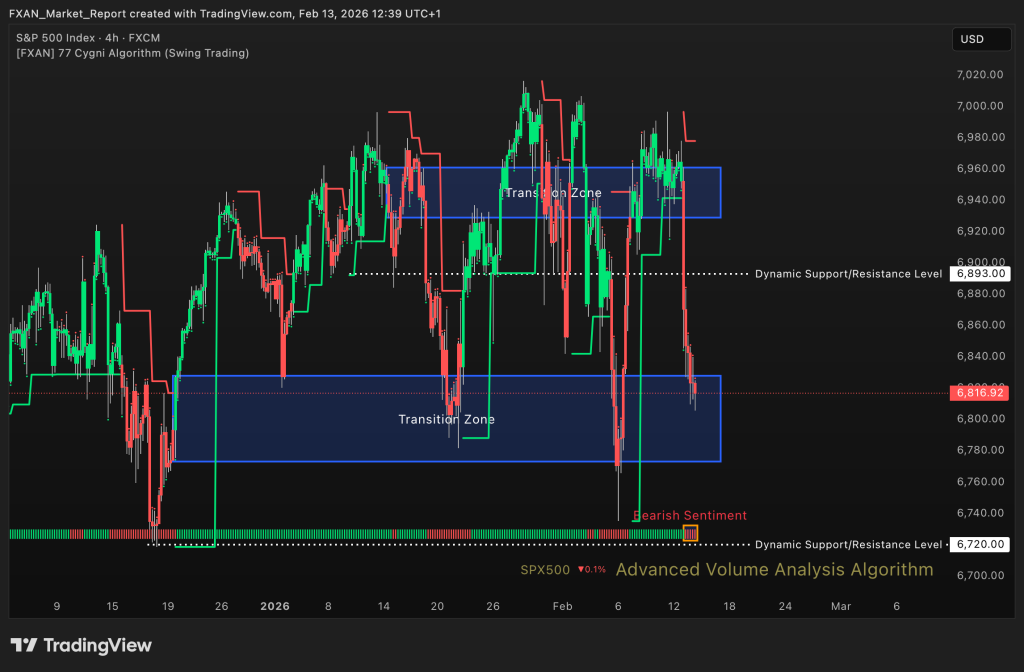
🔹 Overall Sentiment:
Bearish – The S&P 500 has shown bearish sentiment over the last week, with increasing downside volatility. Price has broken below prior support areas, shifting short term structure lower. Sellers are actively defending recovery attempts. The broader tone remains cautious while below resistance levels.
🔹 Transition Zones:
6773 – 6828 – Bullish Transition Zone.
This zone represents a major support cluster now being tested. Sustained trading below it confirms bearish continuation pressure.
6929 – 6961 – Bearish Transition Zone.
This upper zone acts as strong resistance following recent rejection. Bulls would need to reclaim it to shift momentum back upward.
🔹 Dynamic Support/Resistance Levels:
Price: 6720
This level marks key structural support beneath current price. A break below would accelerate downside risk.
Price: 6893
This level acts as near term resistance. Remaining below it maintains bearish control.
🔹 Commentary:
Equity momentum has softened with increased volatility. Recovery attempts lack sustained strength. Market structure shows lower highs forming. Sellers remain dominant while price trades under reclaimed resistance levels.
BTC/USD (Bitcoin)
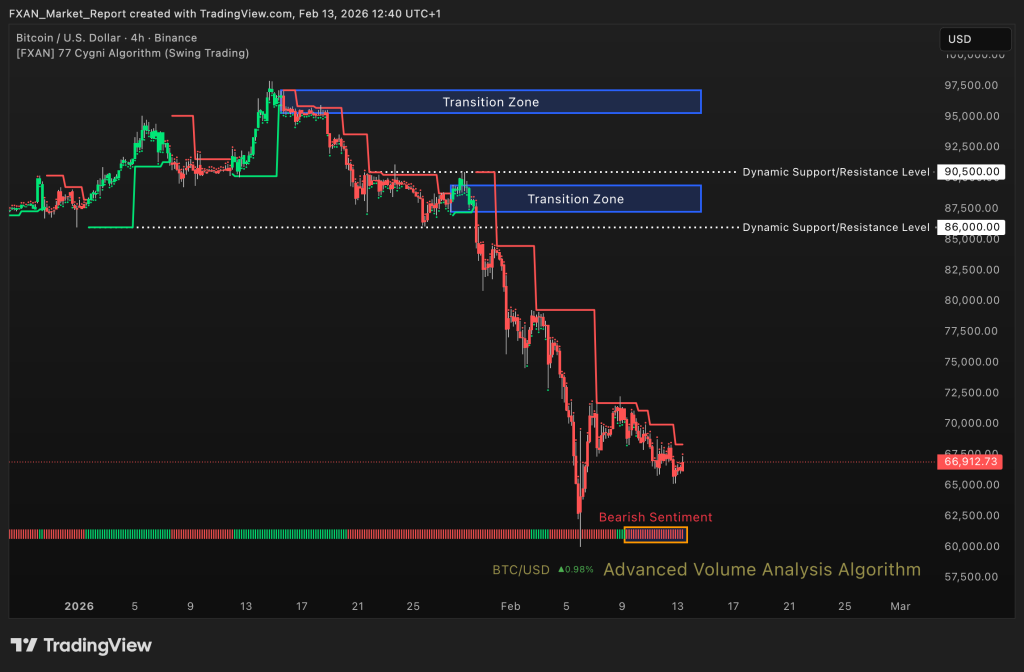
🔹 Overall Sentiment:
Bearish – BTC/USD maintains bearish sentiment over the last five days, characterized by sustained downside movement. Lower highs and weak rebounds confirm continued seller dominance. Momentum remains negative across short term structure. The broader bias stays bearish below major resistance zones.
🔹 Transition Zones:
95,300 – 97,150 – Bearish Transition Zone.
This zone represents a major distribution region from prior highs. It remains a strong long term resistance area.
87,250 – 89,400– Bullish Transition Zone.
This zone previously acted as consolidation before breakdown. It now serves as a significant resistance band on any recovery attempts.
🔹 Dynamic Support/Resistance Levels:
Price: 88,200
This level has turned into resistance following prior breakdown. Sustained trading below it confirms bearish continuation.
Price: 90,500
This higher level represents key structural resistance. A move above it would be required to shift the broader bias.
🔹 Commentary:
Bitcoin continues to struggle under persistent selling pressure. Short term bounces remain weak and corrective. Market structure reflects ongoing distribution. Downside risk remains elevated while price trades below key resistance levels.