
EUR/USD
🔹 Overall Sentiment:
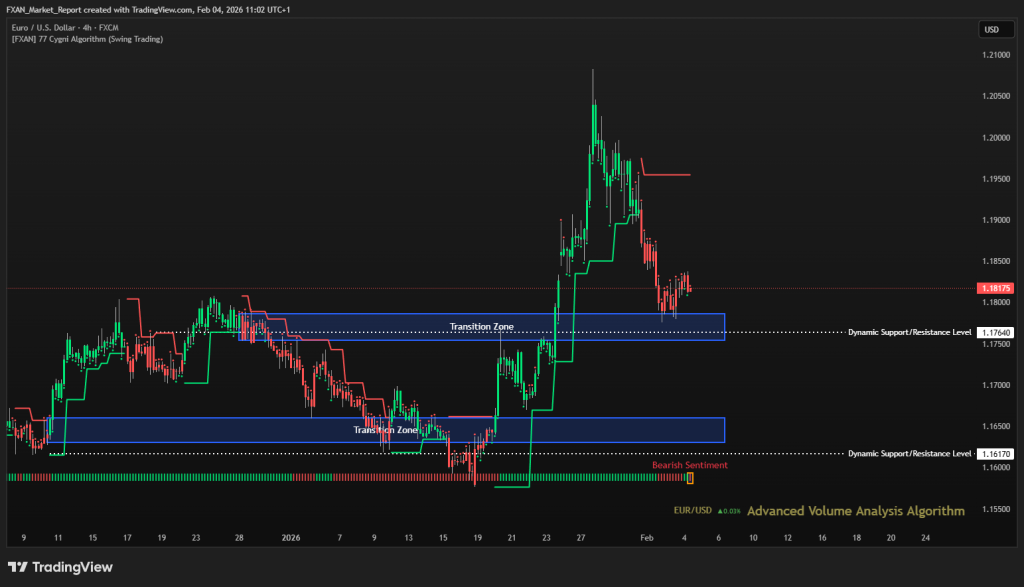
Bearish – EUR/USD has shifted into short term bearish sentiment over the last hours following a sharp impulsive rally that failed to sustain higher levels. Price is now consolidating below recent highs, signaling profit taking and weakening bullish momentum. The rejection from the upper levels suggests sellers are regaining short term control. As long as price remains capped below resistance, downside pressure may persist.
🔹 Transition Zones:
1.16300 to 1.16600 – Bullish Transition Zone.
This lower transition zone represents a strong demand area where buyers previously stepped in aggressively. A revisit into this zone would be closely watched for potential stabilization or renewed buying interest.
1.17540 to 1.17865 – Bearish Transition Zone.
This upper transition zone now acts as a key supply area after the recent rejection. Failure to reclaim and hold above this zone keeps the short term bearish bias intact.
🔹 Dynamic Support/Resistance Levels:
Price: 1.17640
This level is acting as immediate resistance following the breakdown. Price acceptance below it reinforces short term downside risk.
Price: 1.16170
This lower level defines the next major support if selling pressure accelerates. A clean break below it would confirm a deeper corrective phase.
🔹 Commentary:
The recent pullback appears corrective after an extended bullish move, rather than a full trend reversal at this stage. Volume dynamics indicate reduced buying strength near the highs. Short term price action favors consolidation or further downside toward lower support areas. A shift back above key resistance would be required to restore bullish momentum.
GBP/USD
🔹 Overall Sentiment:
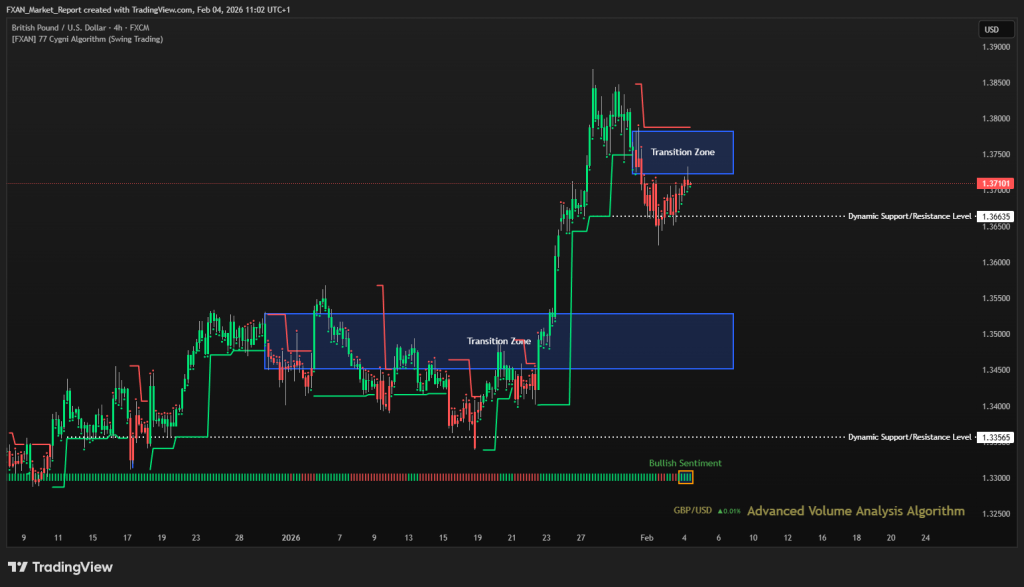
Bullish – GBP/USD maintains a bullish sentiment over the last two days, supported by strong impulsive upside momentum and higher price acceptance. Despite short term pullbacks, buyers continue to defend key levels, keeping the broader structure constructive. The recent advance suggests sustained demand rather than a short lived spike. As long as price holds above major supports, the bullish bias remains intact.
🔹 Transition Zones:
1.34515 – 1.35285– Bearish Transition Zone.
This lower transition zone represents a strong accumulation area where buyers previously absorbed selling pressure. Any pullback into this zone would likely attract renewed buying interest and act as a structural base.
1.37230 – 1.37820– Bearish Transition Zone.
The upper transition zone is a key reaction area following the recent rally. Consolidation or rejection here will determine whether price can extend higher or requires deeper rotation.
🔹 Dynamic Support/Resistance Levels:
Price: 1.33565
This level marks a major downside invalidation point for the current bullish structure. A sustained break below it would weaken the medium term outlook significantly.
Price: 1.36635
This level acts as immediate dynamic support following the recent upside move. Holding above it keeps momentum in favor of buyers and supports continuation scenarios.
🔹 Commentary:
Price action remains constructive with higher highs and higher lows still intact. Volume behavior suggests controlled pullbacks rather than aggressive distribution. Short term consolidation above dynamic support would favor another upside attempt. A decisive move through the upper transition zone would confirm further bullish continuation.
GOLD (XAU/USD)
🔹 Overall Sentiment:
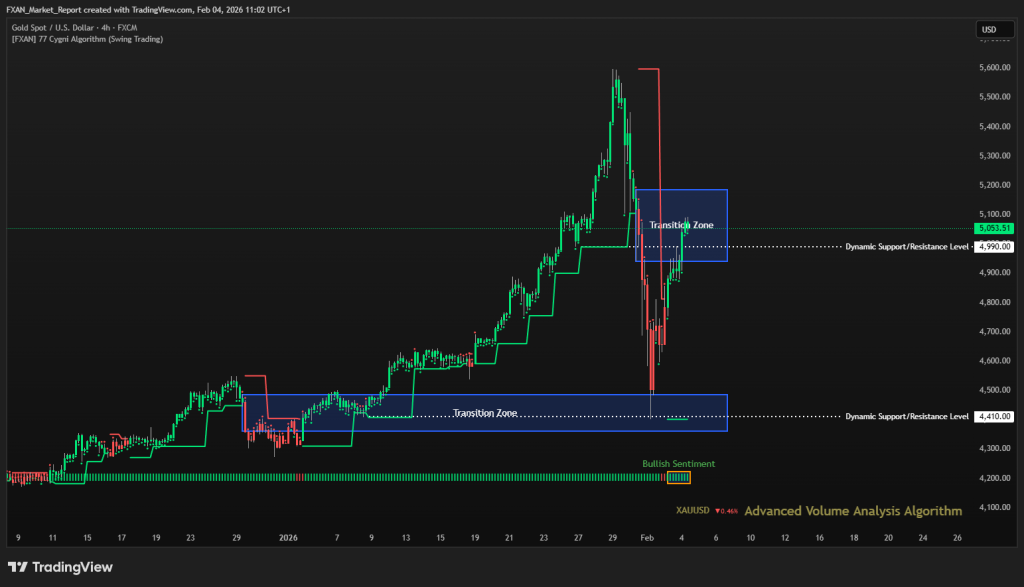
Bullish – XAU/USD retains a bullish sentiment over the last day, supported by a strong rebound following the sharp corrective move. Buyers stepped back in aggressively, pushing price back above key dynamic levels and restoring short term bullish control. The broader structure remains constructive, with higher demand visible after the sell off. As long as price stabilizes above key support, upside continuation remains favored.
🔹 Transition Zones:
4360 – 4485 – Bearish Transition Zone.
This lower transition zone represents a major accumulation base from which the broader bullish trend originated. Any deeper pullback into this area would likely be met with strong buyer interest and act as a long term structural support.
4940 – 5185 – Bearish Transition Zone.
The upper transition zone is currently the main reaction and decision area for price. Sustained acceptance within this zone would support continuation higher, while rejection could trigger short term consolidation.
🔹 Dynamic Support/Resistance Levels:
Price: 4410
This level serves as a key downside anchor for the bullish structure. A break below it would signal a deeper corrective phase and weaken the broader bullish outlook.
Price: 4990
This level acts as immediate dynamic support following the recent rebound. Holding above it keeps short term momentum aligned with buyers and supports further upside attempts.
🔹 Commentary:
Price action shows strong recovery characteristics, suggesting the recent sell off was corrective rather than structural. Volume behavior supports renewed accumulation after the dip. Short term consolidation above dynamic support would be healthy before any continuation. A decisive push toward the upper end of the transition zone would confirm renewed bullish strength.
WTI (Crude Oil)
🔹 Overall Sentiment:
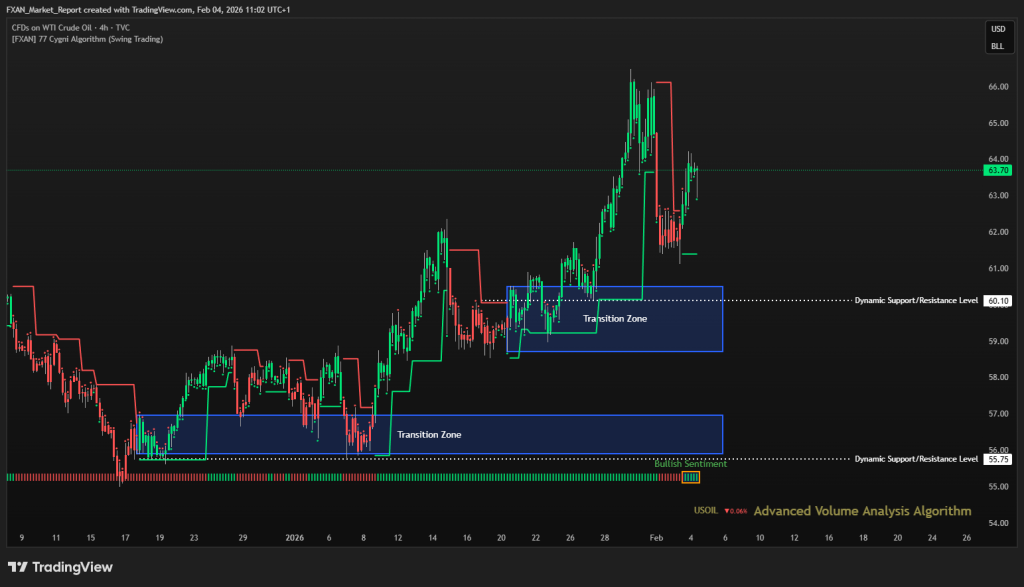
Bullish – WTI Crude Oil maintains a bullish sentiment over the last day, supported by a strong impulsive move followed by constructive consolidation. Price remains well above both transition zones, confirming that buyers are still in control despite recent volatility. The rebound from the pullback suggests demand is active at higher levels rather than aggressive distribution. As long as price holds above key dynamic support, the bullish bias remains intact.
🔹 Transition Zones:
55.90 – 56.95 – Bullish Transition Zone.
This lower transition zone represents a major accumulation base that previously absorbed selling pressure. Any deeper retracement into this area would likely attract strong buying interest and reinforce the broader bullish structure.
58.70 – 60.50 – Bullish Transition Zone.
The upper transition zone acted as a key consolidation and breakout area before the recent upside expansion. Holding above this zone confirms it as a strong demand region and supports continuation higher.
🔹 Dynamic Support/Resistance Levels:
Price: 55.75
This level marks a critical structural support for the broader trend. A sustained break below it would signal a significant shift in market control and weaken the bullish outlook.
Price: 60.10
This level now acts as immediate dynamic support after the breakout. As long as price remains above it, bullish momentum is likely to persist with pullbacks viewed as corrective.
🔹 Commentary:
Price action shows healthy trend behavior with shallow pullbacks and strong follow through from buyers. Volume dynamics support accumulation rather than distribution at current levels. Short term consolidation above dynamic support would be constructive before another push higher. Overall structure continues to favor upside continuation unless key supports are decisively lost.
S&P 500
🔹 Overall Sentiment:
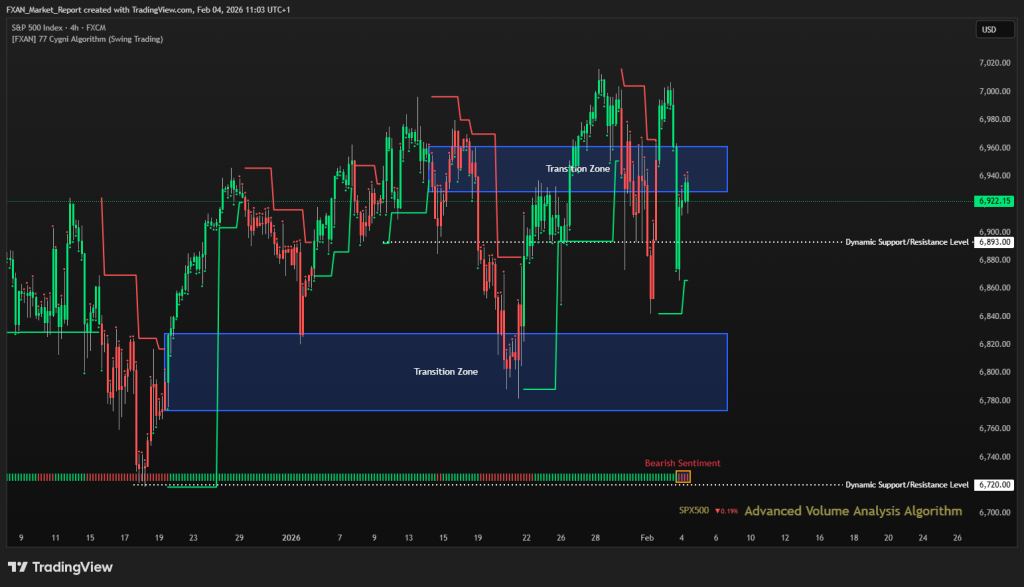
Bearish – The S&P 500 has shifted into a short term bearish sentiment over the last day after failing to sustain acceptance above recent highs. Price is currently reacting near the upper transition zone, signaling increased selling pressure and reduced bullish follow through. The rejection suggests that buyers are becoming more selective at elevated levels. Unless price reclaims key resistance decisively, downside risk remains present in the near term.
🔹 Transition Zones:
6773 – 6828 – Bullish Transition Zone.
This lower transition zone represents a strong demand area where previous sell offs were absorbed effectively. A move back into this zone would likely trigger responsive buying and act as a key stabilization area for price.
6929 – 6961 – Bearish Transition Zone.
The upper transition zone is currently acting as a supply region, with price showing rejection and volatility within this range. Failure to hold above this zone reinforces it as short term resistance and keeps bearish pressure active.
🔹 Dynamic Support/Resistance Levels:
Price: 6720
This level serves as a major structural support and a line in the sand for the broader trend. A clean break below it would confirm deeper bearish continuation and a shift in medium term structure.
Price: 6893
This level is acting as immediate dynamic resistance after the recent pullback. Sustained trading below it favors further downside or consolidation before any meaningful recovery attempt.
🔹 Commentary:
Price action reflects distribution rather than accumulation at current levels, with sharp rejections following upside attempts. Volatility has increased, suggesting uncertainty and active participation from sellers. A period of consolidation or a deeper retracement toward lower support zones would be technically healthy. For now, momentum favors caution until buyers regain control above dynamic resistance.
BTC/USD (Bitcoin)
🔹 Overall Sentiment:
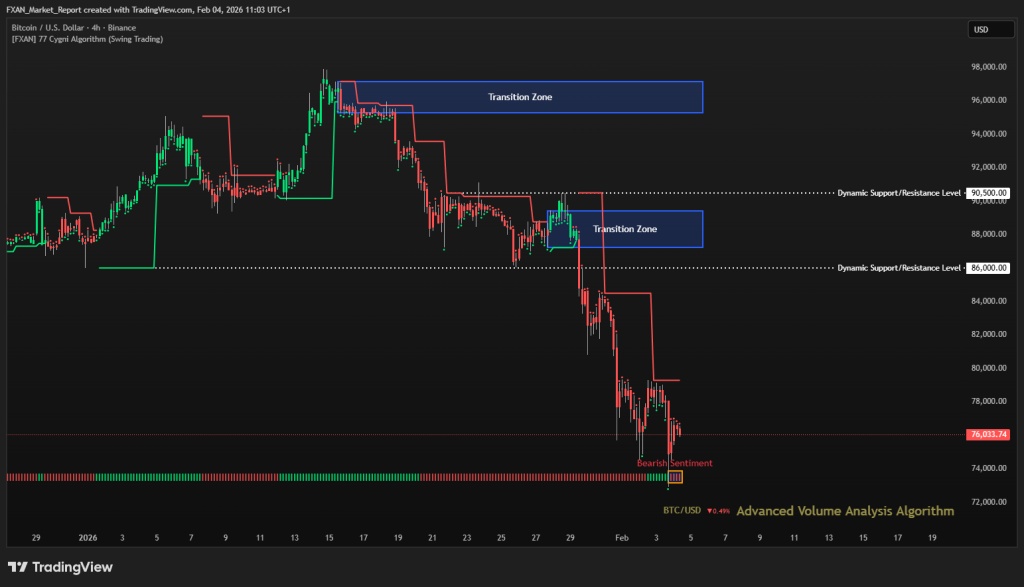
Bearish – BTC/USD remains under strong bearish sentiment over the last day, with price extending lower and failing to establish any meaningful recovery. The market is trading well below key dynamic levels, confirming sustained selling pressure and weak demand. Momentum continues to favor sellers, and recent bounces appear corrective rather than impulsive. Until price reclaims higher structural levels, the bearish bias remains dominant.
🔹 Transition Zones:
95,300 – 97,150 – Bearish Transition Zone.
This upper transition zone represents a major supply area where aggressive selling previously emerged. A move back into this zone would likely be met with strong resistance and renewed distribution.
87,250 – 89,400– Bullish Transition Zone.
This mid range transition zone previously acted as temporary consolidation before the breakdown. Any retracement into this area may attract short term sellers and cap upside attempts.
🔹 Dynamic Support/Resistance Levels:
Price: 88,200
This level now acts as a key overhead resistance after being decisively broken. Failure to reclaim it keeps bearish structure intact and limits recovery potential..
This higher dynamic level marks a critical bearish invalidation point. A sustained move above it would be required to shift sentiment away from the current downside bias.
🔹 Commentary:
Price action shows strong downside continuation with limited bullish response, indicating controlled selling rather than panic. Volume dynamics suggest sellers remain in control as price trades below all major resistance zones. Short term consolidation or minor pullbacks are possible but are technically corrective. A structural shift would require acceptance back above the lower transition zone, which currently appears unlikely.