
EUR/USD
🔹 Overall Sentiment:
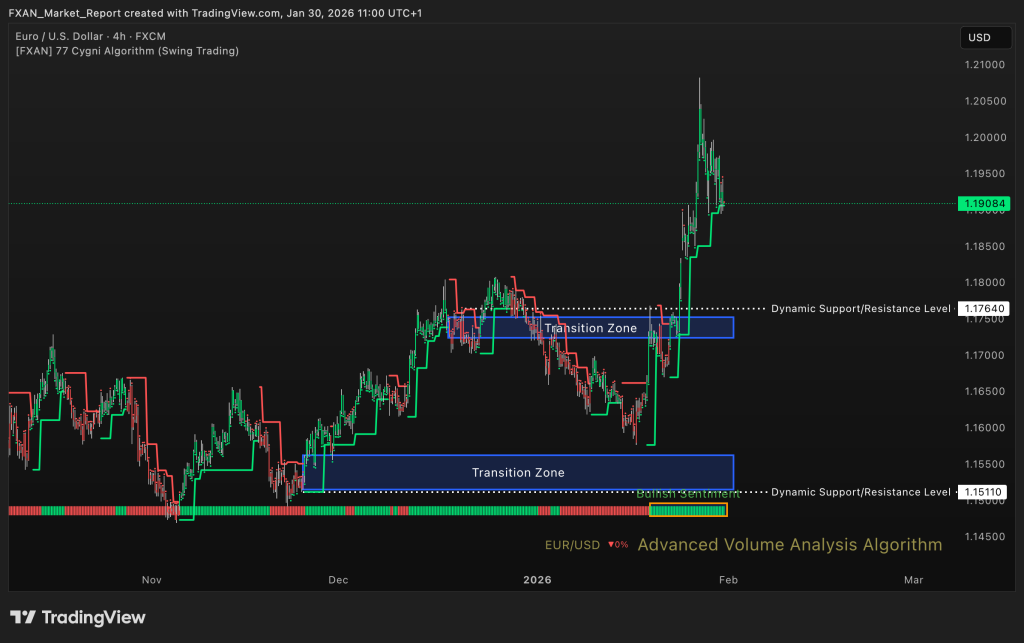
Bullish – EUR/USD maintains a bullish sentiment for almost two weeks, supported by strong impulsive upside momentum and consistent higher highs. Price has decisively broken above prior consolidation, confirming bullish control in the short to medium term. Buyers continue to defend pullbacks aggressively, keeping the structure intact. As long as price remains above key support levels, the bullish bias remains dominant.
🔹 Transition Zones:
1.15150 – 1.15620 – Bullish Transition Zone.
This lower transition zone represents a major accumulation area where bullish momentum previously originated. A retracement into this zone would likely attract strong buyer interest and serve as a structural base for trend continuation.
1.17240 – 1.17520 – Bearish Transition Zone.
The upper transition zone has now been flipped from resistance into support. Holding above this zone confirms strength and reinforces the bullish breakout structure.
🔹 Dynamic Support/Resistance Levels:
Price: 1.15110
This level acts as a key structural support and trend invalidation point. A sustained break below would weaken the current bullish outlook significantly.
Price: 1.17640
This level is now functioning as dynamic support following the breakout. Continued acceptance above it supports further upside continuation.
🔹 Commentary:
EUR/USD is trading in a strong bullish expansion phase following a clean breakout from consolidation. Volume behavior aligns with bullish continuation rather than exhaustion. Pullbacks remain corrective and shallow, indicating strong demand. Overall market structure favors continuation unless price reclaims lower transition zones.
GBP/USD
🔹 Overall Sentiment:
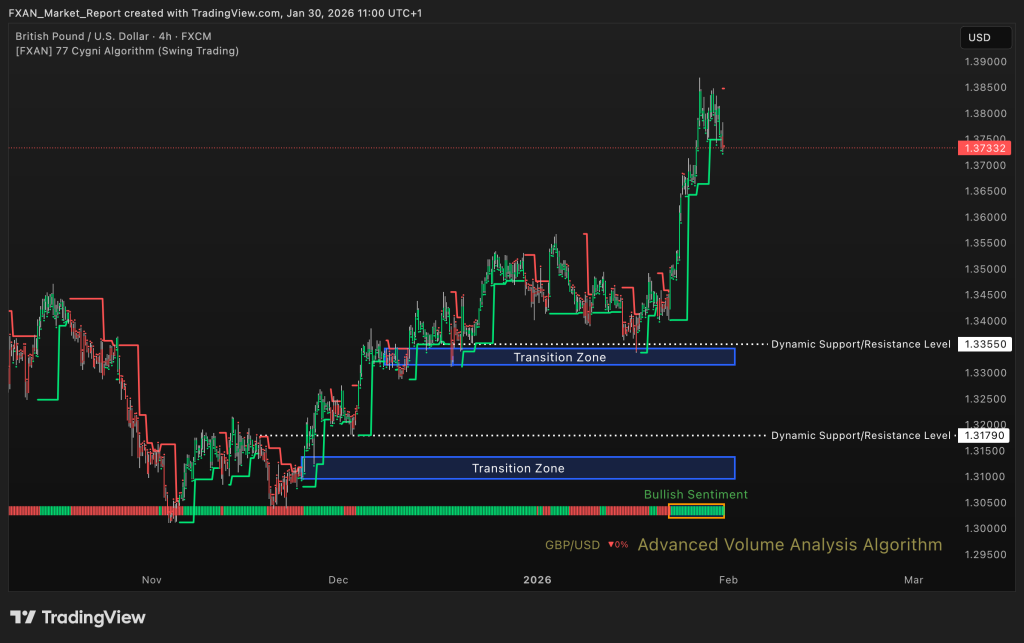
Bullish – GBP/USD is holding a bullish sentiment for the last week, driven by a strong impulsive rally and sustained buyer dominance. Price has accelerated sharply higher, confirming bullish continuation after a successful base formation. Higher highs and higher lows remain intact, signaling strength rather than exhaustion. As long as price stays above key structural supports, the bullish bias remains favored.
🔹 Transition Zones:
1.30960 – 1.31380– Bullish Transition Zone.
This lower transition zone represents a major accumulation area where buyers previously absorbed selling pressure. A deeper pullback into this zone would likely attract strong demand and act as a long term structural support.
1.33150 – 1.33470– Bearish Transition Zone.
The upper transition zone has been clearly reclaimed and now acts as a support base. Holding above this zone reinforces bullish control and confirms the breakout structure.
🔹 Dynamic Support/Resistance Levels:
Price: 1.31790
This level serves as a critical trend support and invalidation point. A sustained break below it would weaken the current bullish structure.
Price: 1.33550
This level is acting as dynamic support following the recent expansion. Continued acceptance above it supports further upside continuationn.
🔹 Commentary:
GBP/USD is currently in a strong expansion phase with momentum favoring buyers. Volume behavior supports continuation rather than distribution, suggesting limited downside risk in the near term. Any pullbacks are expected to remain corrective while holding above key support levels. Overall structure remains bullish unless price re-enters lower transition zones.
GOLD (XAU/USD)
🔹 Overall Sentiment:
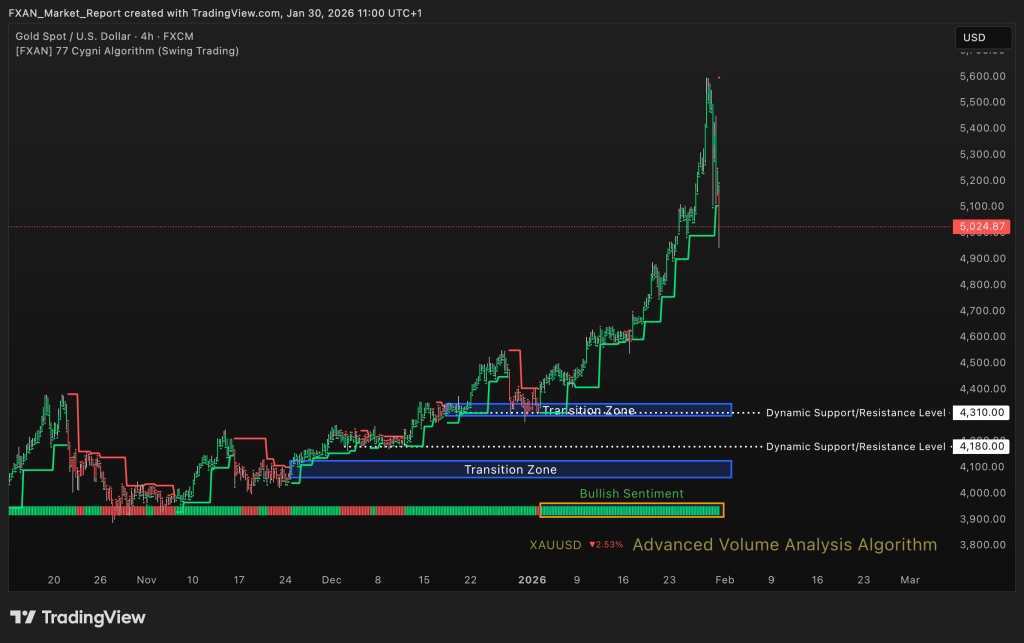
Bullish – XAU/USD remains firmly bullish, sustaining upside momentum for the third consecutive week. The market has printed a strong impulsive leg higher, confirming sustained institutional demand and trend continuation. Despite a sharp extension, price structure continues to respect higher highs and higher lows. As long as price remains above key structural supports, the bullish bias stays intact.
🔹 Transition Zones:
4061 – 4125 – Bullish Transition Zone.
This lower transition zone represents a major accumulation base from the early phase of the rally. Any deep corrective move into this zone would likely be met with strong buying interest and long term demand.
4308 – 4345 – Bullish Transition Zone.
The upper transition zone acted as a critical launch area for the recent upside expansion. Holding above this zone confirms that previous resistance has flipped into structural support.
🔹 Dynamic Support/Resistance Levels:
Price: 4180
This level serves as a key medium term support and trend validation point. A sustained break below it would signal weakening bullish control.
Price: 4310
Level 2 has transitioned into a strong dynamic support following the breakout. Holding above this lThis level now acts as dynamic support following the breakout. Continued acceptance above it supports further bullish continuation.
🔹 Commentary:
Gold is currently in a strong momentum driven phase with buyers firmly in control. Volume behavior supports continuation rather than distribution, suggesting pullbacks remain corrective. The overall structure favors trend continuation rather than reversal at this stage. Only a loss of key dynamic supports would shift the broader bullish outlook.
WTI (Crude Oil)
🔹 Overall Sentiment:
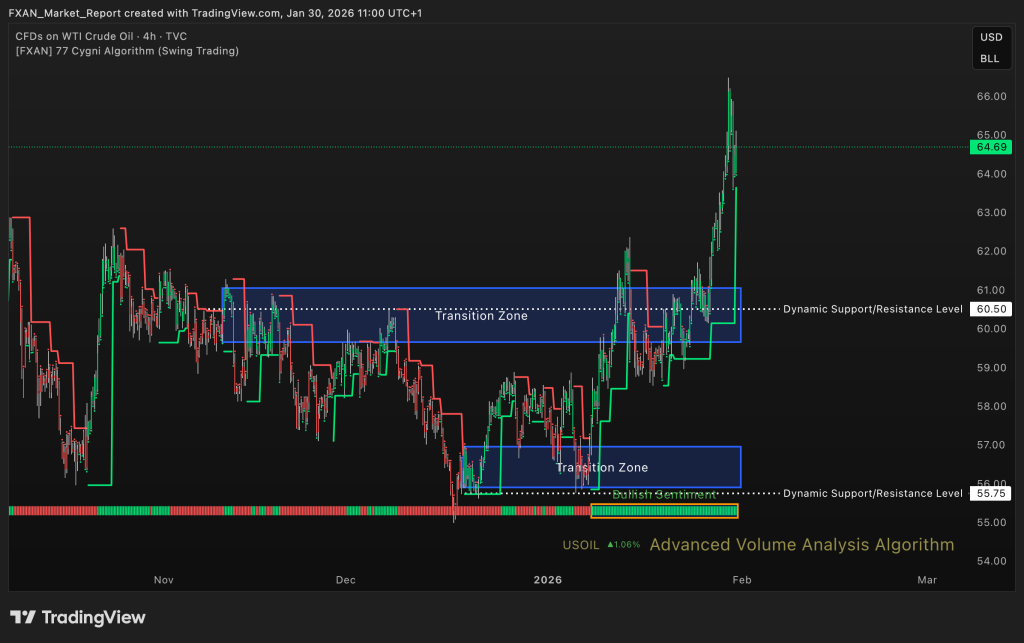
Bullish – WTI Crude Oil continues to trade with a strong bullish bias, extending its upside move for a third consecutive week. The recent impulsive rally confirms a clear shift in market structure, with buyers firmly in control. Price has broken decisively above prior consolidation areas, signaling trend continuation rather than exhaustion. As long as price remains above key dynamic supports, the bullish outlook remains intact.
🔹 Transition Zones:
59.65 – 61.05 – Bullish Transition Zone.
This transition zone marked a prolonged consolidation phase before the latest breakout. Holding above this area reinforces bullish structure and suggests it will act as a strong demand zone on pullbacks.
55.90 – 56.95 – Bullish Transition Zone.
The lower transition zone represents a major accumulation base from which the current trend originated. Any deeper corrective move into this area would likely attract significant buying interest and long term positioning.
🔹 Dynamic Support/Resistance Levels:
Price: 60.50
This level has flipped into a key dynamic support following the breakout. Sustained acceptance above it confirms bullish control and trend strength.
Price: 55.75
This level acts as a broader structural support and trend invalidation point. A break below it would signal a potential shift in market conditions.
🔹 Commentary:
participation. Pullbacks so far remain shallow and corrective, indicating healthy trend behavior. The market shows no clear signs of distribution at this stage. Overall price action favors continuation higher unless key dynamic supports are lost.
S&P 500
🔹 Overall Sentiment:
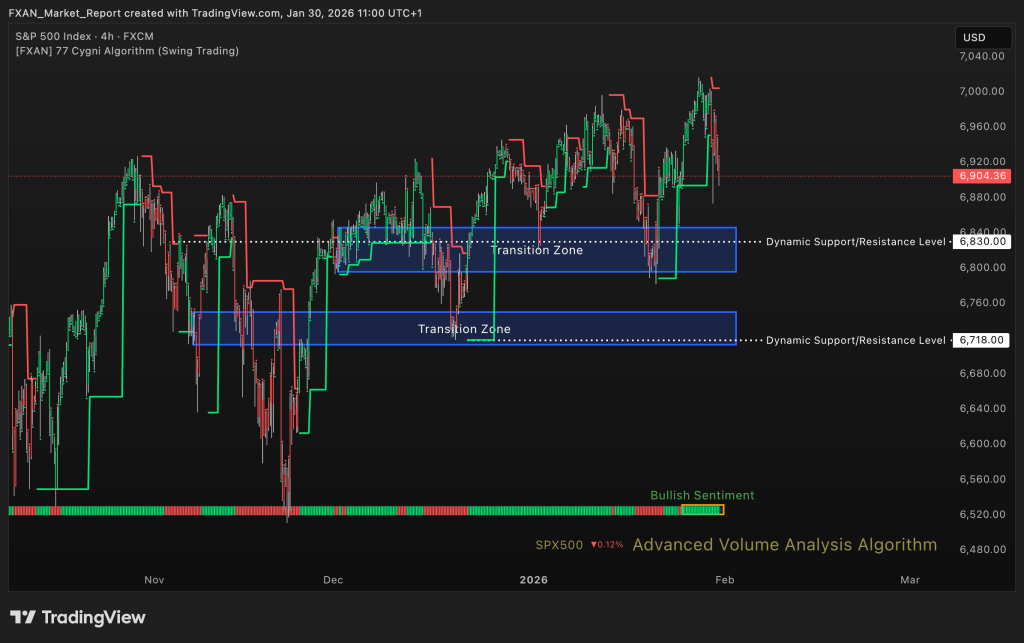
Bullish – The SP 500 continues to trade with a bullish bias after maintaining upside momentum for the past five days. Price remains well supported above prior breakout levels, confirming buyers remain in control. The structure favors continuation as pullbacks stay shallow and corrective. Overall market behavior suggests strength rather than distribution.
🔹 Transition Zones:
6713 – 6750 – Bearish Transition Zone.
This transition zone represents a strong demand base that previously absorbed selling pressure. As long as price remains above this area, it reinforces the broader bullish market structure.
6796 – 6846 – Bullish Transition Zone.
The upper transition zone acted as a consolidation range before the recent upside continuation. Holding above this zone signals acceptance at higher prices and supports further upside potentia.
🔹 Dynamic Support/Resistance Levels:
Price: 6830
This level has flipped into a key dynamic support following the recent advance. Sustained price action above it confirms trend strength and buyer commitment.
Price: 6718
This level serves as a deeper structural support and trend protection zone. A move below it would suggest weakening momentum and a possible shift in market conditions.
🔹 Commentary:
Momentum remains constructive with price respecting higher lows across recent sessions. Buyers continue to defend pullbacks efficiently, keeping volatility controlled. No clear signs of exhaustion or distribution are present at this stage. The overall technical outlook favors continued bullish price development while key supports remain intact.
BTC/USD (Bitcoin)
🔹 Overall Sentiment:
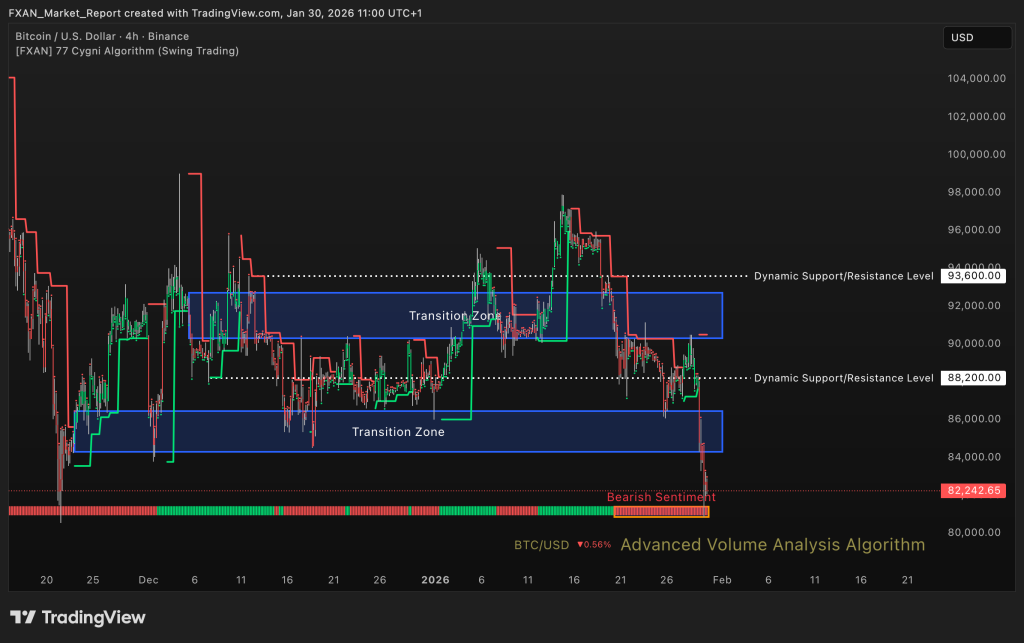
Bearish -BTC/USD remains under clear bearish pressure, extending its downside move for the eighth consecutive day. Price has decisively broken below prior support structures, confirming seller dominance and weak demand response. Momentum continues to favor the downside as rebounds remain corrective and short lived. The broader structure suggests continuation unless strong acceptance back above key levels occurs.
🔹 Transition Zones:
84,300 – 86,450 – Bullish Transition Zone.
This transition zone previously acted as a demand area but has now been cleanly violated. Any retest into this zone is likely to face selling pressure unless price reclaims and holds above it.
90,650 – 93,050– Bullish Transition Zone.
The upper transition zone represents a major supply region and prior distribution range. As long as price trades below this area, the broader bearish bias remains intact.
🔹 Dynamic Support/Resistance Levels:
Price: 88,200
This level has flipped into a strong dynamic resistance after the recent breakdown. Rejection below this level confirms bearish control and limits upside recovery attempts.
Price: 93,600
This level marks a critical structural resistance within the higher range. A move back above it would be required to invalidate the current bearish structure..
🔹 Commentary:
Selling pressure has accelerated with price breaking beneath key supports without meaningful absorption. Market structure shows lower highs and lower lows, reinforcing downside continuation risk. Volatility expansion favors sellers, indicating limited buyer participation at current levels. Unless price reclaims broken resistance zones, the bearish outlook remains dominant.